
Exhaustive analysis of scalp hair regression: subjective and objective perception from initial hair loss to severe miniaturisation and drug-induced regrowth

Abstract
Aim: The reason why non-calibrated hair variables poorly estimate scalp hair coverage during hair growth studies was studied.
Methods: Hair productivity integrates density, diameter and daily hair growth rate. Cross-sectional studies have established hair productivity in female and male patients (480 vs. 90 controls) with self-evaluation of hair loss, phototrichogram (CE-PTG-EC) and scalp coverage scoring, (SCS). Tracking productivity of individual hair follicular units from longitudinal studies challenged the application of our methods during drug trials.
Results: Hair loss means decreased productivity and increased “time to complete coverage”. The hair mass index (HMI) linearly connects productivity with clinical perception of coverage, i.e., SCS. The ensuing HMI abacus translates independently of gender, age, pattern or severity and unravelled unequal intervals between categories of the Ludwig and Hamilton classifications. With one severity grade shift, time to complete coverage varied from 21-51 days, i.e., no equality. During longitudinal studies, SCS detected improved productivity, reflecting clinically relevant responses, but remained stable in the absence of significant productivity variations. Follicular unit labelling and individual hair growth tracing showed that reversal of miniaturised hair follicles does not play a major role during drug-induced hair regrowth. The latter reflects re-activation of resting-dormant terminal hair follicles. The recovered productivity would not be possible once hair follicles enter the phase of structural-functional irreversible miniaturisation.
Conclusion: Besides pattern identification, density of nanohair and HMI appear as innovative diagnostic approaches. Abrupt transformation (within one cycle) of terminal hair follicles into miniaturised ones and its reversal as the effect of active FDA-approved drugs remain highly improbable.
Keywords
Introduction
Hair loss may be a distressing phenomenon and the psycho-social burden in terms of self-perception, body image, loss of attractiveness, etc. remains often misunderstood by practitioners. The phenomenon may be overlooked, its potential prevention or improvement with drug treatment ignored and, in the worst case-scenario, the condition is simply denied by professionals[1-3]. During a face-to-face consultation, dermatologists rely on schematic classifications, and even for trained hair specialists an accurate estimation of “pattern and severity” may remain difficult; test-retest experiments of severity scores on images concluded that clinical classification was unreliable[4].
From a more fundamental perspective, cartoons representing patterns raise a number of questions: How do categories reflect the distribution of a continuum? How many patients do not fit the existing classifications? Is rating of severity consistent? Are intervals between grades equal or not in terms of scalp hair regression? In other words, is the difference between severity Grades I and II the same as between Grades II and III, between Grades IV and V, etc.?
Therefore, clinicians have intuitively proposed a wider variety of schemes and extended scales but without supportive evidence that this clinical approach was actually an improvement. In short, the meaning of severity during a clinical diagnostic process in terms of hair productivity is still lacking.
Productivity has to be understood as follows: What amount of hair can be optimally produced by a single organ or a community of organs with the existing resources (nutritional status, genetic-regional variations, hormonal status, etc.)?
From a clinical perspective, we classify patients according to the simplest and most popular schematic representations appearing in textbooks[5]. Firstly, the discrete patterning and severity grades were described by Hamilton[6], who pointed out the essential role of androgens in balding males. Findings that were highlighted by social-historical perspectives[7] soon followed with Ludwig’s classification of patterned loss in females[8]. Secondly, non-invasive methods were employed to record various objective aspects of the scalp hair loss, i.e., global images that correlated with deficient hair replacement and hair follicle miniaturisation[9,10]. Thirdly, recently published therapeutic assays showed that the perception of clinical status could be subject to rapid changes of hair productivity[11-13], albeit without involving a significant fluctuation of miniaturised hair follicles[14]. The latter may also reflect fine tips during the initial steps of a new hair cycle (less than 15 days)[10].
During drug trials, patients have usually not shifted from a more severe to a less severe category or pattern. However, this does not necessarily mean that patients were subjectively satisfied with the therapeutic response[15]. With these discrepancies, the categorical system keeps diagnostic value with little interest for measurement of the therapeutic response.
This paper reports the results of a cross-sectional study with systematic clinical observation, self-evaluation and exhaustive analytical measurements of the scalp hair dynamics on a large number of patients complaining of hair loss. This complex computation resulted in an abacus that helps the observer to translate his clinical quantitative observations into hair productivity, i.e., hair mass index (HMI). While words such as “hair mass” usually refer to a substantial amount of hair without precise measurements, the evidence and rationale for choosing HMI are exposed in Supplement File 1. A short historical note is given as Supplement File 2 explaining the authors’ progression on his way towards accurate and precise hair measurement. With the data from the cross-sectional study at hand, we tested HMI in situations with synchronised short-term changes of hair cycling. Documents from longitudinal placebo-controlled trials (published and unpublished) were re-analysed in terms of global changes and detailed scalp hair productivity.
The present paper proposes innovative non-invasive bio-engineering approaches to document individual hair follicle productivity. Along with follicular unit monitoring, hair productivity matches much better than hair counts the perspective of clinical relevance. The new findings are in line with earlier publications, providing further scientific support against the prevailing dogma that miniaturised scalp follicles would be responsible for drug-induced hair regrowth. Accordingly, this unproven theory on “reversal” should be abandoned, unless duly documented and proven. Finally, we realise that surgeons and dermatologists involved in scalp hair follicle transplantation and drug trials still face an unanswered question: Where does the regrowing hair come from? We provide tentative answers and propose a speculative hypothesis in Supplement File 3 with baseline characteristics of follicular units that may point to a potential for drug-induced regrowth.
Material and methods
Subjects
Patients and healthy controls in cross-sectional studies
Non-invasive observational methods for scalp hair were applied in 497 patients who complained of stable or slowly progressive and chronic hair loss for more than 6 months and less than 15 years. All were seen with clean dry scalp hair by a single observer between 2006 and 2019. Their data have never been published before.
The clinician applied his original “listen, look and touch” approach[9]. Gentle hair pulling was systematically performed. Patient’s data were compared with functional data collected from 90 observations from healthy controls (52 male and 38 female). Because gender substantially affects clinical presentation, we detail female groups first and male groups next. From a total of 370 female patients with hair loss data, those with specific diagnoses such as trichotillomania, active inflammatory diseases such as alopecia areata or scarring disorders were excluded (66 females). Whenever required, scalp biopsies were taken for differential diagnosis.
Females maintaining a dense frontal fringe in contrast with the scalp located behind, i.e., on the top of the head, were classified as having PHL. Otherwise, they were rated as “no pattern” (NoP) or “Other”. The latter meant less clearly marked or even mixed distribution of hair densities. As an example, “Other” would be used in the case of combined male and female patterns and diffuse loss at the same time. In the case of patterning, the severity grades were based on cartoons derived from Ludwig’s classification[8] [Ludwig I-III; Figure 1]. These five categories help to split up all subsequent continuous data [scalp coverage scoring (SCS) and hair productivity].
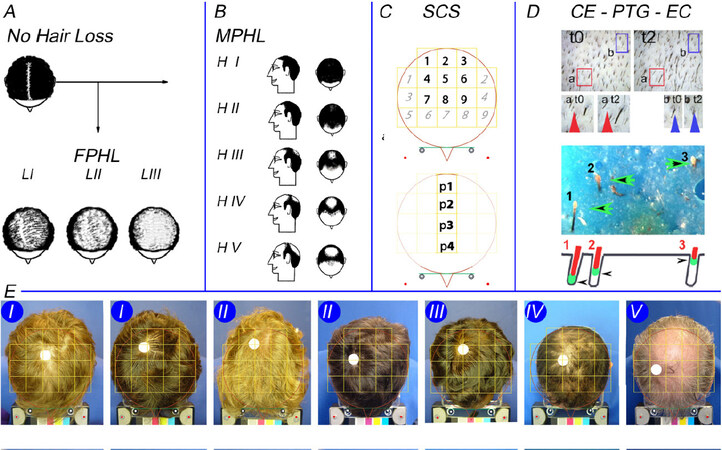
Figure 1. Evaluation of hair loss by patients and clinician with our phototrichogram method and scalp coverage scoring. Figure 1 illustrates all the techniques used throughout this study. Figure 1A and B displays cartoons employed by investigator and patients. From normal coverage or no visible hair loss [Figure 1A; top left], the patients independently choose either no visible loss or FPHL split-up according to Ludwig stages [LI-LIII; bottom of Figure 1A] or MPHL [Hamilton stages HI-HV in Figure 1B]. Similarly, and without direct interaction with the patient’s record, the clinician classified subjects as having diffuse or patterned hair loss (PHL). The SCS [Figure 1C] was usually performed on the computer screen. This implies the subdivision of the image of the top of the head into 18 square fields surrounded by a circle, a symbolic outline of the head. With the hair combed as spokes of a wheel, SCS was evaluated in 2 different ways: first scoring the nine numbered fields that include top and vertex [Figure 1C, top; 1-9 bold] followed by the nine other fields with more lateral and anterior locations [Figure 1C, top; italic light]. Finally, on the image taken after parting hair along the midline, coverage was estimated in each of the four squares labelled p1-p4 [Figure 1C, bottom]. At the end of the clinical visit, the investigator selected a region of interest (ROI). This site served for detailed hair growth measurements employing the CE-PTG-EC [Figure 1D]. Our phototrichogram method is illustrated (modification of the original Figure 1 in the author’s publication to which we refer the interested reader[15,16]). Classical and novel processing methods are illustrated in greater detail in Figures 11 and 12. Exogen collection is part of our phototrichogram method, as shown in the lower half of Figure 1D where three loosely attached telogen bulbs were entrapped in the blue matrix examined under a stereomicroscope. The schematic view [bottom of Figure 1D; arrowheads] illustrates the same 3 exogen hairs: Exogen 1 was deeply set in the follicle at completion of telogen; Exogen 2 was moving upwards in the hair follicle; and Exogen 3 almost reached the scalp surface for release in the nearby future. Figure 1E shows clinical examples of male subjects with MPHL according to Hamilton’s scale with hair combed as spokes of a wheel (left to right; severity Grades I-V). For the correct interpretation of data from the clinical perspective, readers are invited to keep three things in mind: (1) The frontal hairline does not appear in the global view and, as a consequence, should not interfere with SCS; (2) The variable shape/size of the head does not interfere with SCS as the scalp areas explored in a given subject are stable over time; and (3) ROI is remote from the epicentre of the balding process (white dot usually on the right side of patient’s top of the head). FPHL: Female pattern hair loss; MPHL: male pattern hair loss; SCS: scalp coverage scoring, CE-PTG-EC: contrast-enhanced phototrichogram with exogen collection.
The pool of 304 females was compared with unaffected young healthy controls (15-20 years old) and split according to clinical pattern, severity and age. Besides 255 females with FPHL, i.e., LI (n = 135, 44-year-old), LII (n = 107, 45-year-old), and LIII (n = 13, 51-year-old), there were 39 showing no pattern (NoP; n = 39, 41-year-old) and a few remaining patients with a mixed condition grouped as “Other” (n = 10, 52-year-old). After excluding a small number of male subjects with specific disorders (n = 17), the remaining 110 males were split according to Hamilton’s classification with severity Grades I-V [HI-HV; Figure 1]. Male demographics with average age were as follows: HI (n = 6, 19-year-old), HII (n = 28, 21-year-old), HIII (n = 50, 34-year-old), HIV (n = 16, 38-year-old) and HV (n = 10, 39-year-old).
With a few exceptions, all participants completed a pre-printed questionnaire including self-estimation of hair loss. This was given on the first day of the consultation and should ideally be filled out before the second visit. Besides personal and family history and quality of life issues (not published herein), patients proceeded with self-estimation of their hair loss using the same cartoons as the clinical observer [Figure 1].
All patients underwent all clinical measurements and imaging methods reported in the next sections, the most important from the clinical-functional point of view being standardised global imaging combined with Contrast-Enhanced-Phototrichogram with Exogen-Collection (CE-PTG-EC), as illustrated in Figure 1 and published in detail previously[10,16].
Volunteers engaged in longitudinal drug trials
Images and unmodified source data were retrieved from three controlled assays.
One unpublished drug trial in MPHL evaluated daily application of a topical anti-androgen (multi-centre study, six months duration with evaluations at baseline, Month 3 and Month 6). The same analytical protocol as the one employed in the present study showed no statistically significant changes of hair productivity over time in any treatment group. We retrieved the global clinical scoring generated on 27 MPHL subjects followed in our evaluation centre. In total, 81 SCS records were used to test reproducibility through test-retest analysis.
From our oral study on finasteride (Propecia™, 1 mg/day) with topical application of either minoxidil 5% (Alostil™, 1 mL/day) or a placebo lotion during the initial 3 months[13], we selected the best responder with acute changes of hair cycling (switch-on of growth during topical treatment and switch-off after arrest of topical applications). Source global images were re-evaluated, and detailed hair growth parameters were translated into hair productivity, as explained below.
Finally, we re-examined high resolution processed images of one volunteer with stabilised MPHL [third year daily intake of oral finasteride (1 mg/day)]. While test scalp site remained unresponsive to a six-month assay with the LASER-comb[17], this subject mounted a rapid response to the topical application of minoxidil (5%, 1 mL, 1 × /day). We tracked all calibrated hair on a follicular basis from baseline until the end of the third month of combined treatment.
Ethics
All study protocols and measurement methods (experiments including healthy volunteers, patients and drug trials) were approved by the local board of Ethical Commission for Clinical Investigation, implying that identification of participants would not be possible by any means. Facial recognition would be impossible and parental permission was obtained for the youngest subjects (16 years).
Imaging technology
Global images
All patients presented with clean dry hair after their latest shampoo on the morning of the clinical visit. The clinician estimated hair loss, actual presence of a pattern and severity grades. The aspect of the top of the head was recorded employing an original imaging system. After correct positioning of the customised stereotactic headgear and after switching on the “build-in-light-box”, standard images were taken at fixed angle and distance[10,15]. The procedure included dry scalp hair combing in two different ways: spokes of a wheel [Figure 1] and midline parting [Figures 2 and 3].
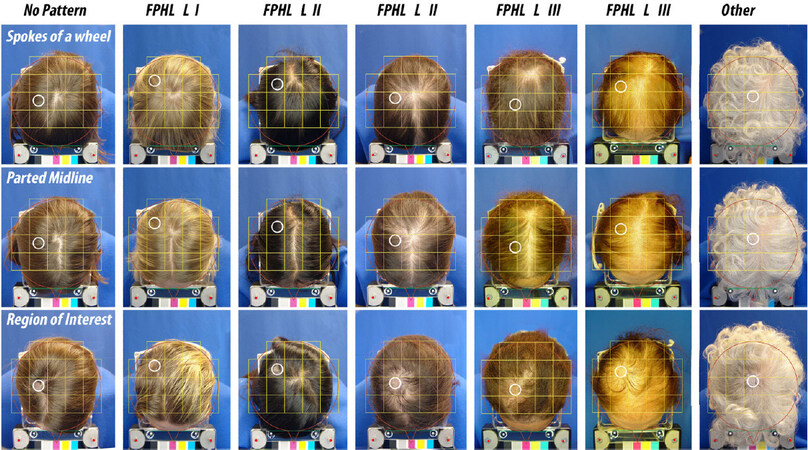
Figure 2. Images from top of the head in females. The top of the head is illustrated in seven females complaining of hair loss. The upper panels show clinical perception as: “No Pattern” (left; 1 case); FPHL graded as LI (1 case), LII (2 cases) or LIII (2 cases) and one subject with no clear evidence for patterning (Other; 1 case). From top to bottom, the panels show hair combed in spokes of a wheel, with a parted midline and with the clipped hair site. The latter is highlighted as a white empty circle. The region of interest (ROI) outline, located at a distance from the epicentre, was then transposed on the other views (top 2 rows). Note again that top of the head views did not include the frontal margin, which does not influence the scalp coverage scoring (SCS). When required according to the study protocol, the clinician measured scalp coverage in vivo (SCS in vivo; described in the next section), while charge coupled device images (source document) were used at a later stage to evaluate scalp coverage scoring on the computer screen (see next section). A third view was recorded to document precisely the topography of the ROI that was selected by the clinician not only at the preferred location, i.e., leading edge of the balding process, but also in agreement with the acceptance by the patient. This ROI might be either clinically unaffected or clinically invaded by the extension of a clearly visible balding process, as illustrated typically in HIII-HV [Figure 1] and LII and LIII [Figure 2]. The ROI was subject to detailed scalp hair functional evaluation with our phototrichogram method (as detailed below). FPHL: Female pattern hair loss.
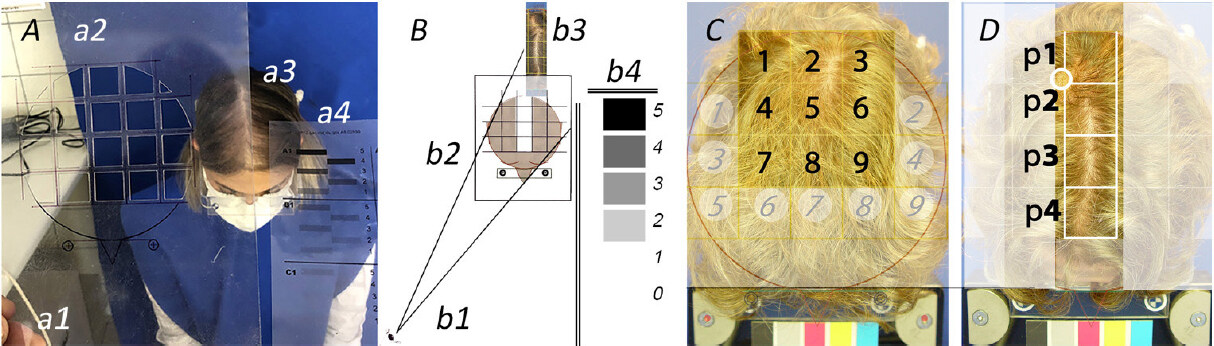
Figure 3. Performing scalp coverage scoring (SCS) in vivo and on computer screen. For illustration purposes, a female patient seen recently agreed to be part of this project showing how SCS can be performed in vivo. Figure 3A shows the investigator’s hand (a1) while adjusting the handheld transparency [(a2) carved out 18 squares] to the frontal headgear worn by the patient (a3). The facial mask indicates that the image was taken during the 2020 SARS-CoV-2 pandemic. The observer starts scoring by analogy with the scale of “difficulty” [shown in (a4)]. Schematically, Figure 3B symbolises the eye of the clinician (b1) who looks through a carved-out transparency (b2). This particular SCS grid illustrates how the clinician should focus on the midline fields in same patient (b3) while referring to a scale of “difficulty”. The latter (b4) displays a series of shaded areas where “5” means “it is very difficult to observe the scalp skin through the hair” while “0” means “no difficulty at all observing the skin through the hair”. We further illustrate the influence of hairstyling on performing SCS on the top of the head of a male patient. This male patient with Hamilton II appeared already with hair combed as spokes of a wheel [Figure 1E, first case on the left graded as II]. Figure 3C shows the same but enlarged image along with 18 numbered fields of the grid (bold and paler italic numbers; left). After combing with midline parting, a new SCS was performed [Figure 3D; p1-p4]. While scalp skin can be barely perceived in Figure 3C (SCS range 4-5), the scalp skin was much more easily visible in between the hair in Figure 3D (SCS range 3-4).
When required according to the study protocol, the clinician measured scalp coverage in vivo (SCS in vivo; described in the next section) while Charge Coupled Device-images (CCD; source document) were used at a later stage to evaluate scalp coverage scoring on the computer screen (see next section). A third view was recorded to document precisely the topography of the “Region Of Interest” (ROI) that was selected by the clinician not only at the preferred location, i.e., leading edge of the balding process, but also in agreement with the acceptance by the patient. This ROI might be either clinically unaffected or clinically invaded by the extension of a clearly visible balding process as illustrated typically in HIII-HV [Figure 1] and LII and LIII [Figure 2]. The ROI was subject to detailed scalp hair functional evaluation with our phototrichogram method (as detailed below).
Scalp coverage scoring
The SCS was validated in 2006[18], i.e., before launching this study.
Briefly, a standardised transparent grid was superimposed on the global view of the top of the head appearing on the computer screen. The dimensions were secured with stereotactic headgear worn while images were captured; this objective ruler served during all subsequent imaging procedures. The templates outlined a total of 18 squares [Figures 1 and 2]. Each square in its bi-dimensional projection on a curved surface represents a scalp area approximately 16 cm2 (4 cm × 4 cm). Every single square field was scored (from 0 to 5) against a built-in scale (from 5 to 0). The scale helps the clinician during the scoring. SCS of a given field represents the difficulty to observe scalp skin in between the hair: a score of 5 means “very difficult” while 0 means “not difficult at all”. As SCS is obviously an observer-dependent parameter, trained expert observers refer to an abstract mental representation of “difficulty”.
In the present study, firstly, SCS was performed on the top of the head with hair combed in spokes of a wheel: Score the nine fields remote from the frontal hair line and closer to the vertex [Figure 1C, top; 1-9; bold]. Proceed with scoring on the nine remaining squares located at the periphery [Figure 1C, top; 1-9; light italic].
The sum of scores on the vertex and the sum of scores on periphery were recorded separately.
Secondly, SCS was performed on the scalp view with hair parted along the midline, a routine standardised procedure introduced during clinical trials[19]. The four squares located on the midline [Figure 1C, bottom; p1-p4 bold] were analysed and the sum of scores in these four fields was recorded.
More work on validation of new experts for correct application of SCS method is planned (see Acknowledgements Section), but, once trained, observers clearly did not require an infinite variety of scales.
SCS in vivo followed the same guidelines with real time observation of the top of the head through a handheld device, as shown in Figure 3.
SCS on midline-parted hair is an innovative clinical procedure that reduced the influence of hairstyle on SCS, as shown in Figures 2 and 3, while alterations in the frontal hair line (not part of SCS) would be considered as “earliest” steps into patterning. A pattern with normal SCS might help find the most specific analytical hair diagnostic criterion, if any, in the analytical approach.
In fact, hairstyle means cumulative growth and depends on the length reached after the last haircut; thus, a very short hair cut by hairdresser is a limitation to correct performance with SCS, and this will be illustrated during longitudinal studies.
Contrast enhanced phototrichogram with exogen collection
The CE-PTG-EC procedure including exogen collection, henceforth referred to as our phototrichogram, has been described and validated previously[20,21] against serial sectioning of scalp biopsies from balding males. Our phototrichogram exhaustively explores structural and functional hair variables in the region of interest (ROI).
The scalp spot was usually 12-17 cm above the middle of the right eyebrow, most often between 2 and 4 cm to the right-hand side of the scalp midline, as illustrated in Figures 1-3.
Before selecting this spot ideally at the leading edge of the balding process, we took into account the patients’ willingness as it relates to personal hairstyling.
Images were captured employing a LED equipped lens mounted on a CCD camera (Dermlight™). A typical sequence consisted of a first visit (t0) with clipping of the scalp hair, dyeing of the clipped spot and image capturing, followed by a second visit (t2; two days after t0) during which a new image was captured immediately after a second hair dye session and after exogen collection as described below.
Exogen hair counts
As stated above, phototrichogram implies that the ROI was subject to non-invasive extraction of the shedding hair employing a specific validated exogen removal process[22]. The non-invasively entrapped exogen hairs were examined under a stereomicroscope at 40× magnification and reported as units/cm2. No attempt was made to calibrate precisely the diameter of the collected exogen hair.
Hair variables involved in the measurement of scalp hair follicle productivity
Unless specifically mentioned, absolute numbers per unit area (1 cm2) are given preferably throughout this paper. Patient data were compared with reference values obtained with identical technology in healthy controls under known conditions of accuracy (technological variability < 3%[10,16]).
Customised software was developed to perform computer-assisted image analysis (CAIA) on manually processed images. This included the perfect overlay of each calibrated individual fibre at t0 and t2. Then CAIA generated many hair parameters based on counts per unit area, diameter and growth rates.
The increase in length of individual hair fibres was established on stubbles seen at t0 and t2. By dividing the increase in length of individual hair fibres by the exact time elapsed between t0 and t2, we measured linear hair growth rate (LHGR) as µm/24 h. Each hair fibre was also calibrated using rulers within the range from < 20 to ≥ 100 µm (steps of 10 µm). Scalp hairs were categorised from the thickest to thinnest miniature hair. The latter comprised: (a) nanohair with a diameter < 20 µm (no growth staging was attempted on nanohair); and (b) miniature, which also included vellus and/or vellus-like hair, as any hair thicker than a nanohair with a diameter < 40 µm.
It is generally accepted that thicker and deeply set follicular roots would produce terminal hair during their growth phase, i.e., anagen. Herein, we report growth for all categories (except nanohair) taken separately from 20 µm to the terminal fibres with diameters ≥ 60 µm. Subgroups such as 20-30 µm are quoted as miniaturising while 40-50 µm are quoted as intermediate hair.
Linear hair growth rate discriminates between resting (telogen) and anagen growth staging
As with diameters, there was also a threshold for growth staging. Anagen stages were statistically distinct from non-growing stages (catagen-telogen) based on the bimodal distribution of elongation per time unit. The threshold between growth and rest phases was established on data collected in healthy controls, i.e., linear hair growth rate (LHGR, µm/24 h).
Compound Index of Hair Growth and Time To Complete Coverage
Productivity of individual hair follicles integrating growth rate and diameter generated the compound index of hair growth (CIHG). The implementation of density generates a cumulative index of growth that includes all growing follicles. The relative value of the latter reflects the fraction of scalp area under investigation that would be covered by daily hair growth on that very site. Calculation encompassed all growing hair in all diameter classes (classes taken one by one from thinnest ≥ 20 µm and < 30 µm to the largest ≥ 100 µm diameters) along with their respective average LHGR:
CIHG = [number anagen per unit area (n/cm2) × average linear growth rate (µm/24 h) × diameter (µm)].
The average value of CIHG in patients can be expressed relative to the surface of the ROI. We report this in our cross-sectional study as well as during longitudinal studies or as it relates to a control group.
Nevertheless, while CIHG remains an excellent techno-scientific parameter[12,13], we devised a more practical way of expression. The purpose was to offer practising dermatologists and patients a dimension intuitively known in our daily life, i.e., “Time To Complete Coverage” (TTCC). The latter value was conceived as follows: If every single growing hair appearing on the scalp surface were placed flat on the scalp surface, perfectly adjacent to its neighbours, how much time would it take to cover the ROI completely?
During preliminary assays, we noted that the volumetric calculations were not mandatory. Hair diameter - in the present experimental setting - is related to the width appearing in the bidimensional image against the scalp surface.
The precise surface of the field under investigation was based on the points of origin of the hair fibre as they relate to the individual follicular units (FU). Each stubble exits from an acro-infundibulum and the scalp area outlined by all and any measured follicular unit was established by the CAIA as being 100%, i.e., an exhaustive measure of FU density (FUD).
The reverse of the relative area covered per day [(%/day)−1] reflects the time (days) required to hit 100% coverage (TTCC). As an example, our calculated TTCC in healthy controls with an approximate 5% CIHG means that it would take 20 days to hit the “100% healthy control TTCC”. Comparatively, the TTCC in a balding subject with 2% daily coverage would be 50 days.
Innovative approaches during longitudinal studies
Global SCS (variation over time and reproducibility)
SCS was performed three times on 27 subjects during a six-month period. Hence, triplicate observations with 81 SCS data could be tested for possible variation over time. As the SCS rating was made one image at a time, images were randomised and the observer was considered as blinded to the time. The SCS was performed before unsealing the envelopes containing the treatment codes and, as a consequence, before the eventual efficacy of the test compounds would be known.
Today, from our analytical procedures, we acknowledge the absence of statistically significant changes of hair productivity with these test compounds (unpublished data). We draw the attention of clinicians to the following: if SCS were performed during longitudinal studies, it would consistently match identical fields as those already outlined at baseline.
Correlation of SCS with acute fluctuations of hair follicle productivity
As a technological challenge for the SCS, we selected the best responder from a previously published trial and calculated his time to complete coverage (TTCC) from the published hair follicle productivity (CIHG)[13]. We correlated the ensuing time to complete coverage with global clinical images recorded during the year preceding the entry into the drug trial protocol until its end. Compliance was rated as excellent until completion at the 24th month on the drug. Baseline SCS and analytical procedures followed the protocol of combined drugs (oral finasteride and topical lotion containing 5% minoxidil) during the initial three months, followed by monotherapy (finasteride 1 mg/day) until completion. We refer the interested readers to previous papers regarding the SCS values fitting expert ratings for drug filing at the FDA[18] and for measuring subjective satisfaction with scalp hair responses[10,15].
Tracking of individual hair follicle productivity during drug trials
We evaluated a single subject with MPHL known to be on chronic oral finasteride[23] who completed a six-month LASER-comb study protocol[17]. The subject volunteered for an extended three months of monitoring of the same scalp sites. After two phototrichograms performed at one-week interval (baseline), the volunteer entered the three-month study aiming at measuring biological potential for hair regrowth. Along with maintenance of oral drug intake, the subject applied daily a single spray of minoxidil 5% lotion on the monitored test site (< 1 cm2). The compliance of daily oral drug intake and topical application of a drop of minoxidil lotion (5%) was rated higher than 99% on the basis of a hand-ticked diary.
The technician involved in image processing was unaware of the ongoing treatments.
The purpose of this study was to investigate whether minoxidil 5%, once a day, would improve the hair loss under stabilising effects of long-term oral treatment (over three years of daily intake of finasteride, 1 mg/day; Propecia™) while, in the same site and same subject, a six months controlled use of LASER-comb had no significant effect on hair growth[17].
To visualise the individual hair productivity, an innovative dot mapping technique was developed.
Accordingly, the original hand-processed phototrichogram images were subject to the novel dot-mapping technique. The latter first exhaustively established the FUD in the monitored scalp field. The FUD map was exhaustively completed through back-and-forth travelling along the three-month time-scale in images probing the ROI.
The FUD map was then transposed as a background on each phototrichogram and allowed tracking of the follicular unit responses after one and three months of combined treatment.
The next step was to overlay on each FUD the productivity of individual hair follicle on a hair-to-hair basis.
The point of exit from the follicular opening of each growing segment was marked by a calibrated dot employing a predefined colour code: magenta, 20-30 µm; blue, 40-50 µm; green, 60-70 µm; and yellow, ≥ 80 µm. The productivity was symbolised by the diameter of the dots: yellow > green > blue > magenta. This correlates but does not reflect exactly the product of diameter × linear growth rate. For an improved readability, we organised and highlighted productivity with hair dots that would be large enough to be seen in the published paper and, at the same time, not overlapping between them but remaining clustered to the productive FUD.
Finally, each FUD was numbered to organise the individual hair data and keep a record of changes occurring over time providing data and statistics reflecting changes of hair growth on a follicular basis.
Descriptive statistics and statistical analyses
Cross-sectional studies
The subjective perception of hair loss that brought the patient to the clinic, the cartoons selected by the patients and the ensuing clinical diagnosis made by the observer were considered as categorical or discontinuous data, i.e., undisputable. The investigator did not communicate his selection of severity to the patient. Consistency of self-evaluation of severity and its deviations from the grades established by the clinical observer are commented as relative frequencies of subjects attributing “identical” or “different scores” but not reported as averages.
The clinical diagnosis served to split up all subsequent continuous data (SCS and all hair measurements).
Descriptive statistics of absolute values (average and standard deviation of samples) were preferred and always displayed versus healthy controls. For clinical use, relative frequencies and proportions are reported in two ways: as percentiles of patients lower than P05 or exceeding the P95 value found in controls or as the actual values in patient groups expressed as a percentage of reference values [for example, averages in patients as a per cent of control values or per cent of the measured value relative to the highest possible value (maximum)]. Relative values are identified clearly and always given comparatively to absolute values.
After checking normality of the data distribution, a global analysis of variance (ANOVA; Statview®) was used for comparing all source data, i.e., continuous parameters in healthy controls vs. patients or between patient subgroups.
Tables 1-8 report clearly on the global statistically significant differences vs. controls when P values were P < 0.05, P < 0.01 and P < 0.001, symbolised, respectively, with *, ** and ***. Once global significance of differences was established, the Bonferroni/Dunn test was used to evaluate statistically significant differences between each clinical category vs. gender-matched healthy controls, as symbolised by “S”.
Descriptive statistics of absolute hair densities along with categories of hair fibre diameter
| Density according to Diameter | ||||||||||||||||
|---|---|---|---|---|---|---|---|---|---|---|---|---|---|---|---|---|
| Group | age | Parameter | Nanos (< 20 µm) | 20 µm | 30 µm | 40 µm | 50 µm | ≥ 60 µm | Total | |||||||
| P value | P | P | P | P | P | P | P | |||||||||
| F CONS | 15-20 | average | 6 | *** | 18 | * | 48 | ** | 45 | *** | 78 | *** | 118 | *** | 315 | *** |
| st dev | 5 | 8 | 15 | 22 | 30 | 53 | 31 | |||||||||
| NoP | 40 | average | 23 | S | 13 | 24 | S | 18 | S | 29 | S | 163 | S | 250 | S | |
| 8 | st dev | 26 | 11 | 17 | 16 | 25 | 59 | 60 | ||||||||
| LI | 44 | average | 28 | S | 18 | 33 | S | 30 | S | 44 | S | 112 | 239 | S | ||
| 13 | st dev | 21 | 16 | 27 | 22 | 31 | 61 | 52 | ||||||||
| LII | 45 | average | 36 | S | 21 | 34 | S | 31 | S | 29 | S | 58 | S | 176 | S | |
| 15 | st dev | 25 | 15 | 29 | 22 | 19 | 37 | 52 | ||||||||
| LIII | 48 | average | 53 | S | 23 | 24 | S | 20 | S | 16 | S | 36 | S | 120 | S | |
| 13 | st dev | 63 | 21 | 14 | 12 | 15 | 22 | 33 | ||||||||
| Other | 52 | average | 23 | 20 | 33 | 28 | 35 | S | 102 | 220 | S | |||||
| 15 | st dev | 11 | 15 | 27 | 17 | 16 | 71 | 51 | ||||||||
| M CONS | 15-20 | average | 5 | *** | 16 | ** | 27 | *** | 24 | NS | 42 | 173 | *** | 290 | *** | |
| st dev | 5 | 11 | 14 | 16 | 26 | 45 | 60 | |||||||||
| HI | 26 | average | 27 | 12 | 21 | 37 | 57 | 127 | 254 | |||||||
| 5 | st dev | 19 | 7 | 13 | 29 | 35 | 45 | 71 | ||||||||
| HII | 27 | average | 30 | S | 14 | 18 | 23 | 37 | 131 | S | 225 | S | ||||
| 5 | st dev | 18 | 9 | 13 | 18 | 27 | 47 | 47 | ||||||||
| HIII | 34 | average | 35 | S | 20 | 32 | 32 | 38 | 92 | S | 217 | S | ||||
| 9 | st dev | 21 | 13 | 24 | 20 | 17 | 46 | 51 | ||||||||
| HIV | 39 | average | 37 | S | 21 | 22 | 29 | 32 | 59 | S | 164 | S | ||||
| 10 | st dev | 34 | 16 | 10 | 16 | 17 | 29 | 41 | ||||||||
| HV | 39 | average | 45 | S | 31 | S | 48 | S | 34 | 32 | 39 | S | 185 | S | ||
| 9 | st dev | 27 | 17 | 27 | 22 | 11 | 24 | 60 | ||||||||
Percentiles of hair densities along with categories of fibre diameter
| Density according to Diameter (Percentile on absolute values) | |||||||||
|---|---|---|---|---|---|---|---|---|---|
| Group | Number of CE-PTG-EC | Parameter | Nanos | Miniaturised | Intermediate | Terminal | Total | ||
| Percentile | <20μm | 20μm | 30μm | 40μm | 50μm | ≥60μm | |||
| F CONS | 38 | P 05 | 0 | 3 | 30 | 18 | 28 | 36 | 261 |
| P 95 | 17 | 33 | 80 | 106 | 120 | 228 | 374 | ||
| NoP | 39 | <P05 | 0 | 23 | 69 | 59 | 69 | 3 | 56 |
| >P95 | 49 | 3 | 0 | 0 | 0 | 13 | 3 | ||
| LI | 133 | <P05 | 0 | 15 | 52 | 32 | 36 | 12 | 65 |
| >P95 | 61 | 13 | 5 | 1 | 2 | 2 | 0 | ||
| LII | 106 | <P05 | 0 | 10 | 56 | 28 | 51 | 33 | 94 |
| >P95 | 72 | 21 | 4 | 1 | 0 | 0 | 1 | ||
| LIII | 14 | <P05 | 0 | 14 | 71 | 36 | 79 | 57 | 100 |
| >P95 | 79 | 21 | 0 | 0 | 0 | 0 | 0 | ||
| Other | 10 | <P05 | 0 | 0 | 70 | 20 | 30 | 30 | 60 |
| >P95 | 60 | 10 | 10 | 0 | 0 | 0 | 0 | ||
| M CONS | 51 | P 05 | 0 | 5 | 9 | 5 | 14 | 97 | 198 |
| P 95 | 19 | 42 | 55 | 58 | 97 | 241 | 402 | ||
| HI | 6 | <P05 | 0 | 17 | 0 | 0 | 17 | 17 | 17 |
| >P95 | 67 | 0 | 0 | 17 | 17 | 0 | 0 | ||
| HII | 28 | <P05 | 0 | 11 | 29 | 4 | 18 | 32 | 21 |
| >P95 | 71 | 0 | 0 | 4 | 7 | 0 | 0 | ||
| HIII | 50 | <P05 | 0 | 12 | 6 | 2 | 18 | 62 | 36 |
| >P95 | 74 | 8 | 10 | 10 | 0 | 0 | 0 | ||
| HIV | 16 | <P05 | 0 | 6 | 13 | 0 | 19 | 94 | 82 |
| >P95 | 63 | 19 | 0 | 6 | 0 | 0 | 0 | ||
| HV | 10 | <P05 | 0 | 0 | 0 | 0 | 0 | 100 | 60 |
| >P95 | 80 | 20 | 30 | 10 | 0 | 0 | 0 | ||
Descriptive statistics of anagen and telogen hair and diameter
| Growth according to diameter | ||||||||||||||||||||
|---|---|---|---|---|---|---|---|---|---|---|---|---|---|---|---|---|---|---|---|---|
| Group | Age | Parameter | Anagen ≥ 20 µm | Telogen ≥ 20 µm | Anagen ≥ 30 µm | Telogen ≥ 30 µm | Anagen ≥ 40 µm | Telogen ≥ 40 µm | Anagen ≥ 50 µm | Telogen ≥ 50 µm | Exogen Tot | |||||||||
| P value | P | P | P | P | P | P | P | P | P | |||||||||||
| F CONS | 15-20 | average | 271 | *** | 37 | NS | 260 | *** | 29 | NS | 223 | *** | 23 | * | 185 | *** | 16 | ** | 3 | *** |
| st dev | 26 | 26 | 25 | 24 | 27 | 19 | 35 | 15 | 4 | |||||||||||
| NoP | 40 | average | 215 | S | 35 | 208 | S | 28 | 189 | S | 25 | 174 | 21 | 3 | ||||||
| 8 | st dev | 58 | 20 | 56 | 19 | 47 | 19 | 45 | 19 | 3 | ||||||||||
| LI | 44 | average | 197 | S | 41 | 189 | S | 32 | 164 | S | 26 | 140 | S | 19 | 4 | |||||
| 13 | st dev | 49 | 23 | 47 | 19 | 48 | 15 | 52 | 13 | 5 | ||||||||||
| LII | 45 | average | 133 | S | 42 | 126 | S | 28 | 103 | S | 20 | 79 | S | 13 | 8 | S | ||||
| 15 | st dev | 47 | 23 | 43 | 17 | 36 | 12 | 34 | 10 | 7 | ||||||||||
| LIII | 48 | average | 80 | S | 40 | 72 | S | 24 | 58 | S | 18 | 44 | S | 11 | 9 | S | ||||
| 13 | st dev | 29 | 21 | 26 | 15 | 23 | 11 | 22 | 9 | 7 | ||||||||||
| Other | 52 | average | 166 | S | 53 | 156 | S | 43 | 138 | S | 34 | 118 | S | 24 | 4 | |||||
| 15 | st dev | 47 | 35 | 47 | 28 | 52 | 20 | 59 | 14 | 2 | ||||||||||
| M CONS | 15-20 | average | 230 | *** | 54 | *** | 223 | *** | 44 | *** | 207 | *** | 37 | ** | 189 | *** | 30 | * | 2 | *** |
| st dev | 44 | 36 | 44 | 29 | 38 | 24 | 32 | 20 | 2 | |||||||||||
| HI | 26 | average | 214 | 39 | 209 | 33 | 194 | 23 | 167 | 13 | 6 | |||||||||
| 5 | st dev | 66 | 12 | 67 | 14 | 59 | 9 | 44 | 13 | 5 | ||||||||||
| HII | 27 | average | 169 | S | 55 | 163 | S | 47 | 151 | S | 40 | 135 | S | 32 | 5 | |||||
| 5 | st dev | 45 | 30 | 42 | 26 | 37 | 23 | 35 | 22 | 5 | ||||||||||
| HIII | 34 | average | 138 | S | 78 | S | 130 | S | 65 | S | 116 | S | 50 | 99 | S | 34 | 6 | S | ||
| 9 | st dev | 38 | 37 | 38 | 31 | 37 | 24 | 38 | 20 | 5 | ||||||||||
| HIV | 39 | average | 96 | S | 68 | 92 | S | 51 | 83 | S | 36 | 68 | S | 22 | 8 | S | ||||
| 10 | st dev | 24 | 34 | 25 | 26 | 26 | 18 | 25 | 15 | 9 | ||||||||||
| HV | 39 | average | 77 | S | 107 | S | 68 | S | 85 | S | 56 | S | 61 | 45 | S | 38 | 10 | S | ||
| 9 | st dev | 30 | 52 | 29 | 45 | 26 | 29 | 24 | 20 | 9 | ||||||||||
Percentiles of anagen and telogen hair and diameter
| Growth according to diameter (Percentile on absolute values) | |||||||||||
|---|---|---|---|---|---|---|---|---|---|---|---|
| Group | Number of CE-PTG-EC | Parameter | Anagen | Telogen | Anagen | Telogen | Anagen | Telogen | Anagen | Telogen | Exogen |
| Percentile | ≥20μm | ≥20μm | ≥30μm | ≥30μm | ≥40μm | ≥40μm | ≥50μm | ≥50μm | Tot | ||
| F CONS | 38 | P 05 | 228 | 11 | 218 | 8 | 157 | 5 | 96 | 2 | 0 |
| P 95 | 315 | 92 | 311 | 88 | 263 | 76 | 228 | 63 | 14 | ||
| NoP | 39 | < P05 | 64 | 5 | 67 | 10 | 13 | 3 | 5 | 5 | 0 |
| >P95 | 3 | 3 | 5 | 0 | 5 | 3 | 10 | 5 | 3 | ||
| LI | 133 | < P05 | 70 | 3 | 71 | 5 | 39 | 4 | 20 | 8 | 0 |
| >P95 | 1 | 5 | 1 | 2 | 1 | 1 | 3 | 0 | 5 | ||
| LII | 106 | < P05 | 95 | 1 | 96 | 4 | 92 | 3 | 75 | 9 | 0 |
| >P95 | 1 | 6 | 0 | 1 | 0 | 0 | 0 | 0 | 22 | ||
| LIII | 14 | < P05 | 100 | 0 | 100 | 7 | 100 | 7 | 100 | 14 | 0 |
| >P95 | 0 | 7 | 0 | 0 | 0 | 0 | 0 | 0 | 21 | ||
| Other | 10 | < P05 | 90 | 0 | 100 | 10 | 50 | 10 | 40 | 0 | 0 |
| >P95 | 0 | 10 | 0 | 10 | 0 | 10 | 0 | 0 | 0 | ||
| M CONS | 51 | P 05 | 146 | 12 | 141 | 10 | 137 | 8 | 127 | 4 | 0 |
| P 95 | 301 | 117 | 295 | 99 | 272 | 81 | 246 | 75 | 7 | ||
| HI | 6 | < P05 | 17 | 0 | 17 | 0 | 17 | 0 | 17 | 17 | 0 |
| >P95 | 17 | 0 | 17 | 0 | 17 | 0 | 0 | 0 | 50 | ||
| HII | 28 | < P05 | 32 | 4 | 32 | 4 | 39 | 0 | 43 | 0 | 0 |
| >P95 | 0 | 7 | 0 | 7 | 0 | 4 | 0 | 4 | 32 | ||
| HIII | 50 | < P05 | 64 | 2 | 60 | 0 | 68 | 0 | 74 | 2 | 0 |
| >P95 | 0 | 10 | 0 | 12 | 0 | 14 | 0 | 4 | 40 | ||
| HIV | 16 | < P05 | 100 | 0 | 100 | 0 | 100 | 0 | 100 | 13 | 0 |
| >P95 | 0 | 13 | 0 | 6 | 0 | 0 | 0 | 0 | 31 | ||
| HV | 10 | < P05 | 100 | 0 | 100 | 0 | 100 | 0 | 100 | 0 | 0 |
| >P95 | 0 | 40 | 0 | 30 | 0 | 20 | 0 | 10 | 50 | ||
Descriptive statistics of productivity of scalp hair
| Anagen % | LHGR (µm/day) | CIHG (µm2/ [cm2 x day]) | CIHG (Tot) | TTCC | ||||||||||||||||||||
|---|---|---|---|---|---|---|---|---|---|---|---|---|---|---|---|---|---|---|---|---|---|---|---|---|
| Group | Age | Parameter | A6% 20-30 µm | A6% 40-50 µm | A6% ≥ 60 µm | LHGR 20-30 µm | LHGR 40-50 µm | LHGR ≥ 60 µm | CIHG 20-30 µm | CIHG 40-50 µm | CIHG ≥ 60 µm | Area % | Days | |||||||||||
| P value | P | P | P | P | P | P | P | P | P | P | P | |||||||||||||
| F CONS | 15-20 | average | 69 | *** | 88 | *** | 96 | * | 273 | ** | 351 | *** | 388 | NS | 442 687 | *** | 1 424 975 | *** | 2 991 946 | *** | 4.37 | *** | 21.26 | *** |
| st dev | 17 | 12 | 5 | 33 | 40 | 46 | 227 593 | 632 903 | 1 542 453 | 1.15 | 5.26 | |||||||||||||
| NoP | 40 | average | 62 | 80 | 91 | 250 | 311 | S | 376 | 188 977 | S | 600 812 | S | 4 274 687 | S | 4.54 | 22.33 | |||||||
| 8 | st dev | 21 | 13 | 7 | 33 | 38 | 48 | 150 181 | 524 192 | 1 882 783 | 1.75 | 11.18 | ||||||||||||
| LI | 44 | average | 59 | 81 | 92 | 256 | 321 | S | 371 | 235 752 | S | 930 922 | S | 2 837 955 | 3.50 | S | 28.95 | |||||||
| 13 | st dev | 20 | 13 | 6 | 38 | 52 | 76 | 228 805 | 646 937 | 1 736 099 | 1.49 | 13.56 | ||||||||||||
| LII | 45 | average | 53 | S | 79 | S | 92 | 247 | S | 307 | S | 362 | 214 260 | S | 693 397 | S | 1 442 349 | S | 1.81 | S | 50.26 | S | ||
| 15 | st dev | 19 | 14 | 9 | 37 | 50 | 72 | 197 369 | 488 210 | 1 024 165 | 1.02 | 22.32 | ||||||||||||
| LIII | 48 | average | 42 | S | 63 | S | 89 | 240 | 297 | S | 330 | 163 931 | S | 350 939 | S | 915 987 | S | 0.86 | S | 88.79 | S | |||
| 13 | st dev | 17 | 25 | 10 | 50 | 60 | 112 | 191 062 | 266 404 | 567 633 | .77 | 43.55 | ||||||||||||
| Other | 52 | average | 56 | 71 | S | 92 | 227 | S | 291 | S | 344 | 178 123 | S | 600 812 | S | 2 445 954 | 2.8 | S | 42.3 | S | ||||
| 15 | st dev | 15 | 17 | 5 | 20 | 33 | 42 | 113 932 | 524 192 | 1 909 572 | 1.75 | 26.19 | ||||||||||||
| M CONS | 15-20 | average | 53 | *** | 73 | *** | 91 | *** | 258 | *** | 324 | *** | 379 | *** | 35 110 | *** | 169 797 | *** | 4 481 186 | *** | 4.81 | *** | 19.62 | *** |
| st dev | 17 | 8 | 7 | 29 | 39 | 47 | 33 187 | 150 498 | 1 341 237 | 1.22 | 5.58 | |||||||||||||
| HI | 26 | average | 56 | 78 | 94 | 281 | 344 | 405 | 151 478 | S | 1 219 377 | S | 3 429 481 | 4.33 | 21.17 | |||||||||
| 5 | st dev | 16 | 18 | 6 | 29 | 37 | 29 | 94 265 | 906 206 | 1 226 371 | 1.03 | 4.07 | ||||||||||||
| HII | 27 | average | 51 | 66 | 84 | 265 | 323 | 377 | 127 431 | S | 634 087 | S | 3 173 898 | S | 3.46 | S | 28.11 | |||||||
| 5 | st dev | 23 | 18 | 10 | 32 | 42 | 46 | 98 522 | 504 651 | 1 458 813 | 1.26 | 10.42 | ||||||||||||
| HIII | 34 | average | 45 | 57 | S | 81 | S | 239 | S | 291 | S | 334 | S | 142 807 | S | 554 870 | S | 1 912 145 | S | 2.10 | S | 44.70 | S | |
| 9 | st dev | 17 | 17 | 13 | 28 | 35 | 59 | 80 127 | 333 062 | 1 199 445 | 1.15 | 20.62 | ||||||||||||
| HIV | 39 | average | 31 | S | 55 | S | 82 | 230 | S | 284 | S | 336 | S | 89 085 | 487 905 | S | 1 162 901 | S | 1.13 | S | 68.75 | S | ||
| 10 | st dev | 15 | 20 | 12 | 22 | 31 | 44 | 34 745 | 306 184 | 701 928 | 0.72 | 28.64 | ||||||||||||
| HV | 39 | average | 29 | S | 42 | S | 75 | S | 218 | S | 258 | S | 291 | S | 122 295 | S | 297 128 | 663 016 | S | 0.6 | S | 119.90 | S | |
| 9 | st dev | 13 | 21 | 19 | 27 | 39 | 45 | 66 915 | 114 144 | 545 567 | 0.84 | 60.70 | ||||||||||||
Percentiles of productivity of scalp hair
| Anagen % | LHGR (μm/day) | CIHG (μm2 / [cm2 x day] ) | CIHG (Tot) | TTCC | |||||||||
|---|---|---|---|---|---|---|---|---|---|---|---|---|---|
| Group | Number of CE-PTG-EC | Parameter | A6% | A6% | A6% | LHGR | LHGR | LHGR | CIHG | CIHG | CIHG | Area% | days |
| Percentile | 20-30μm | 40-50μm | ≥60μm | 20-30μm | 40-50 μrn | ≥60μm | 20-30μm | 40-50μm | ≥60μm | ||||
| F Cons | 38 | P 05 | 34 | 52 | 83 | 228 | 268 | 282 | 166 805 | 258 801 | 817 639 | 3 | 14 |
| P 95 | 92 | 99 | 100 | 328 | 399 | 460 | 914 684 | 2 363 098 | 6 589 147 | 7 | 31 | ||
| NoP | 39 | <P05 | 10 | 5 | 15 | 28 | 15 | 0 | 51 | 21 | 3 | 10 | 8 |
| >P95 | 0 | 10 | 0 | 3 | 0 | 8 | 0 | 3 | 13 | 8 | 10 | ||
| LI | 133 | <P05 | 11 | 3 | 7 | 25 | 11 | 5 | 44 | 10 | 14 | 35 | 1 |
| >P95 | 5 | 4 | 0 | 3 | 7 | 8 | 2 | 2 | 1 | 1 | 35 | ||
| LII | 106 | <P05 | 19 | 2 | 11 | 29 | 20 | 9 | 49 | 14 | 34 | 82 | 0 |
| >P95 | 3 | 6 | 0 | 2 | 3 | 3 | 1 | 1 | 0 | 0 | 81 | ||
| LIII | 14 | <P05 | 43 | 43 | 36 | 50 | 21 | 14 | 71 | 43 | 57 | 100 | 0 |
| >P95 | 0 | 0 | 0 | 7 | 7 | 0 | 0 | 0 | 0 | 0 | 100 | ||
| Other | 10 | <P05 | 0 | 20 | 0 | 50 | 30 | 0 | 60 | 10 | 30 | 50 | 0 |
| >P95 | 0 | 10 | 0 | 0 | 0 | 0 | 0 | 0 | 0 | 0 | 100 | ||
| M Cons | 51 | P 05 | 28 | 39 | 77 | 213 | 258 | 303 | 5 102 | 22 475 | 2 353 961 | 3 | 14 |
| P 95 | 85 | 98 | 100 | 315 | 390 | 441 | 111 269 | 580 467 | 6 547 677 | 7 | 34 | ||
| HI | 6 | <P05 | 0 | 0 | 0 | 0 | 0 | 0 | 0 | 0 | 17 | 0 | 0 |
| >P95 | 0 | 0 | 33 | 33 | 17 | 0 | 50 | 67 | 0 | 0 | 0 | ||
| HII | 28 | <P05 | 11 | 4 | 18 | 7 | 7 | 7 | 4 | 0 | 32 | 21 | 0 |
| >P95 | 11 | 4 | 4 | 4 | 7 | 4 | 39 | 29 | 0 | 0 | 21 | ||
| HIII | 50 | <P05 | 10 | 16 | 26 | 10 | 16 | 10 | 0 | 0 | 74 | 70 | 0 |
| >P95 | 2 | 2 | 6 | 0 | 0 | 0 | 64 | 40 | 0 | 0 | 70 | ||
| HIV | 16 | <P05 | 38 | 19 | 25 | 19 | 13 | 19 | 6 | 0 | 94 | 100 | 0 |
| >P95 | 0 | 0 | 6 | 0 | 0 | 0 | 25 | 38 | 0 | 0 | 100 | ||
| HV | 10 | <P05 | 60 | 60 | 30 | 70 | 50 | 70 | 0 | 0 | 100 | 100 | 0 |
| >P95 | 0 | 0 | 10 | 0 | 0 | 0 | 50 | 0 | 0 | 0 | 100 | ||
Descriptive statistics of scalp coverage scores and percentiles of SCS in controls and deviations in patients
| SCS (absolute arbitrary units) | SCS (relative % of Max) | SCS (Percentile on arbitrary units) | |||||||||||||
|---|---|---|---|---|---|---|---|---|---|---|---|---|---|---|---|
| Group | Age | Field | Vertex | Crown | Mid-parting | Vertex | Crown | Mid-parting | Vertex | Crown | Mid-Parting | ||||
| P value | P | P | P | Max. 45 | Max. 45 | Max 20 | Percentile | ||||||||
| F CONS | 15-20 | 45 | *** | 45 | *** | 19 | *** | 99 | 99 | 97 | P05 | 44 | 44 | 19 | |
| 0 | 1 | 0 | P95 | 45 | 45 | 20 | |||||||||
| NoP | 40 | 44 | 45 | 18 | 98 | 100 | 92 | < P05 | 31 | 0 | 69 | ||||
| 8 | 1 | 0 | 1 | > P95 | 0 | 0 | 0 | ||||||||
| LI | 44 | 42 | S | 45 | 16 | S | 93 | 100 | 82 | < P05 | 68 | 1 | 91 | ||
| 13 | 2 | 0 | 2 | > P95 | 0 | 0 | 1 | ||||||||
| LII | 45 | 38 | S | 44 | 13 | S | 84 | 98 | 64 | < P05 | 93 | 18 | 100 | ||
| 15 | 5 | 2 | 3 | > P95 | 0 | 0 | 0 | ||||||||
| LIII | 48 | 30 | S | 39 | S | 9 | S | 68 | 87 | 45 | < P05 | 100 | 71 | 100 | |
| 13 | 8 | 7 | 4 | > P95 | 0 | 0 | 0 | ||||||||
| Other | 52 | 40 | S | 44 | 16 | S | 89 | 98 | 79 | < P05 | 70 | 20 | 80 | ||
| 15 | 5 | 2 | 3 | > P95 | 0 | 0 | 0 | ||||||||
| M CONS | 15-20 | 44 | *** | 44 | *** | 19 | *** | 98 | 98 | 97 | P05 | 44 | 44 | 19 | |
| 0 | 0 | 0 | P95 | 45 | 45 | 20 | |||||||||
| HI | 26 | 44 | 45 | 17 | 98 | 100 | 87 | < P05 | 33 | 0 | 83 | ||||
| 5 | 2 | 0 | 1 | > P95 | 0 | 0 | 0 | ||||||||
| HII | 27 | 42 | 44 | 17 | S | 93 | 98 | 85 | < P05 | 50 | 7 | 82 | |||
| 5 | 4 | 3 | 2 | > P95 | 0 | 0 | 0 | ||||||||
| HIII | 34 | 39 | S | 43 | 14 | S | 87 | 96 | 71 | < P05 | 78 | 24 | 92 | ||
| 9 | 6 | 4 | 3 | > P95 | 0 | 0 | 0 | ||||||||
| HIV | 39 | 36 | S | 40 | S | 11 | S | 80 | 89 | 56 | < P05 | 94 | 56 | 100 | |
| 10 | 8 | 7 | 5 | > P95 | 0 | 0 | 0 | ||||||||
| HV | 39 | 16 | S | 31 | S | 4 | S | 36 | 69 | 21 | < P05 | 100 | 80 | 100 | |
| 9 | 8 | 12 | 2 | > P95 | 0 | 0 | 0 | ||||||||
Analysis of Variance for all hair parameters and age in patients
| Density [Table 1] | Growth [Table 3] | Productivity (A6 %, LHGR, CIHG, TTCC [Table 5]) | SCS [Table 7] | |||||||||||||||||||||||||||||
|---|---|---|---|---|---|---|---|---|---|---|---|---|---|---|---|---|---|---|---|---|---|---|---|---|---|---|---|---|---|---|---|---|
| Nanos (<20μm) | 20μm | 30μm | 40μm | 50μm | ≥ 60μm | Total | Anagen≥20 μm | Telogen≥20μm | Anagen≥30 μm | Telogen≥30 μm | Anagen≥ 40μm | Telogen≥ 40μm | Anagen≥ 50μm | Telogen≥ 50μm | Exogen tot | A6% 20-30 μm | A6% 40-50 μm | A6% ≥ 60 μm | LHGR 20-30 μm | LHGR 40-50 μm | LHGR ≥ 60μm | CIHG 20-30 μm | CIHG 40-50 μm | CIHG ≥ 60μm | Area % | TTCC Days | Vertex | Crown | Mid-Parting | |||
| ANOVA | 2-way | age groups | (*) | (*) | (*) | ** | ** | (*) | * | |||||||||||||||||||||||
| ** | ** | * | *** | *** | *** | *** | *** | *** | * | *** | *** | *** | *** | ** | (*) | *** | *** | *** | *** | *** | *** | *** | ||||||||||
| interaction age-group | (*) | * | * | |||||||||||||||||||||||||||||
| Female | this group | |||||||||||||||||||||||||||||||
| LI | vs | LII | S | S | S | S | S | S | S | S | S | S | S | S | S | S | S | S | S | |||||||||||||
| vs | LIII | S | S | S | S | S | S | S | S | S | S | S | S | S | S | S | S | S | ||||||||||||||
| vs | NoP | S | S | S | S | S | S | S | S | S | ||||||||||||||||||||||
| vs | Other | |||||||||||||||||||||||||||||||
| LII | vs | LIII | S | S | S | S | S | S | S | S | S | |||||||||||||||||||||
| vs | NoP | S | S | S | S | S | S | S | S | S | S | S | S | S | S | S | ||||||||||||||||
| vs | Other | S | ||||||||||||||||||||||||||||||
| LIII | vs | NoP | S | S | S | S | S | S | S | S | S | S | S | S | S | S | S | S | ||||||||||||||
| vs | Other | S | S | S | S | S | S | S | S | S | S | S | S | |||||||||||||||||||
| NoP | vs | Other | S | S | S | S | S | S | S | S | ||||||||||||||||||||||
| Discrimination power | 3 | 1 | 0 | 2 | 3 | 7 | 6 | 7 | 0 | 7 | 0 | 8 | 1 | 7 | 2 | 3 | 2 | 3 | 0 | 0 | 0 | 0 | 0 | 3 | 6 | 7 | 7 | 6 | 5 | 8 | ||
| TOP ≥7 | ||||||||||||||||||||||||||||||||
| ANOVA | 2-way | age groups | (*) | ** | (*) | ** | (*) | |||||||||||||||||||||||||
| *** | *** | *** | *** | *** | *** | * | *** | ** | ** | ** | ** | ** | (*) | * | *** | *** | *** | *** | *** | |||||||||||||
| interaction age-group | * | |||||||||||||||||||||||||||||||
| Male | this group | |||||||||||||||||||||||||||||||
| H I - H II | vs | H III | S | S | S | S | S | S | S | S | S | S | S | S | S | S | S | S | ||||||||||||||
| vs | H IV-V | S | S | S | S | S | S | S | S | S | S | S | S | S | S | S | S | S | S | S | ||||||||||||
| H III | vs | H IV-H V | S | S | S | S | S | S | S | S | S | S | S | S | ||||||||||||||||||
| Discrimination power | 0 | 0 | 2 | 0 | 0 | 3 | 2 | 3 | 2 | 3 | 1 | 3 | 1 | 3 | 0 | 0 | 2 | 2 | 0 | 2 | 2 | 2 | 0 | 0 | 1 | 3 | 3 | 2 | 2 | 3 | ||
| TOP ≥2 | ||||||||||||||||||||||||||||||||
Tables 1, 3, 5 and the 3 first columns in Table 7 with absolute values are systematically followed by the display of the same parameters with percentiles [Tables 2, 4, 6, and 3 last columns in Table 7] i.e., percentages of patients below the P05 or exceeding the P95 value of gender-matched controls.
Accordingly, the most synthetic parameter “Time To Complete Coverage” (TTCC; day) was tested by simple correlation-regression with midline SCS, i.e., the most powerful SCS.
Finally, Table 8 is a global display of statistics appearing in Tables 1, 3, 5 and 7 in regard with ageing and highlights the best discriminating hair parameters. The effect of ageing was tested with the two-way ANOVA on patients only. As some categories did not contain a sufficient number of subjects within the allocated age ranges, patients with nearest severity constituted one subgroup (e.g., HI-HII). The summary table reports clearly on the global statistically significant differences vs. controls when P values were P < 0.05, P < 0.01 and P < 0.001, symbolised, respectively, with *, ** and ***. When P = 0.05, we added (*). Once global significance of differences was established, the Bonferroni/Dunn test was used to evaluate statistically significant differences between each clinical category vs. gender-matched healthy controls, as symbolised by “S”.
Longitudinal studies
Triplicate evaluations of SCS were tested for changes over the six-month period of observation with Student’s t test.
Observations on acute changes of hair productivity and with SCS initiated by drug treatment[13] are limited to description. Findings are commented in terms of consistency or lack of correlation between methods and are presented along with clinical relevance and interpretation of the findings.
The preliminary validation of training for SCS and regression-correlation between the original investigator and independent external observers is not discussed in the present report.
Results
The present study involved 414 subjects complaining of hair loss. Once questionnaires for self-evaluation were delivered, all were examined by the same investigator between 2006 and 2019 before completion of technological procedures described herein.
Analytical and global data can be found in the tables. After subdividing data for consistent type of parameters, in the two genders separately, clusters were evaluated separately and are presented accordingly in a series of tables reporting descriptive statistics of static and dynamic values.
Hair parameters in gender-matched healthy controls are shown in comparison with the various groups of patients complaining of hair loss.
Absolute data appear in a series of tables with odd roman numbers [Tables 1, 3 and 5]. Tables with even numbers [Tables 2, 4 and 6] display the same parameters with the range of normal values (P05 and P95 percentiles in healthy controls) along with the proportion of patients’ data outside these normal limits.
Selected graphic displays of static or dynamic functional data are shown and commented in this paper. Whenever necessary or crucial, correlation or lack of correlation between the global and analytical data is presented.
The general trend pointed towards decreased follicular performance with disease severity; we found that healthy controls - especially females - had high numbers of rather thin hair (diameter groups 20-30 µm and 40-50 µm). These healthy fine hairs maintained good productivity.
While anagen parameters were usually decreased in patients, the absolute values of density of telogen and exogen hair were not remarkable except in the most severe conditions.
We present the results of cross-sectional studies on analytic static and dynamic parameters first, followed by age-related aspects and more global perception by clinical observers. We end with longitudinal studies and correlate global perception with scalp hair follicle productivity and suggest novel approaches capable of tracing performance of hair follicular units.
Cross-sectional studies
Static parameters: hair counts
The usual static data such as density appear in Figure 4.
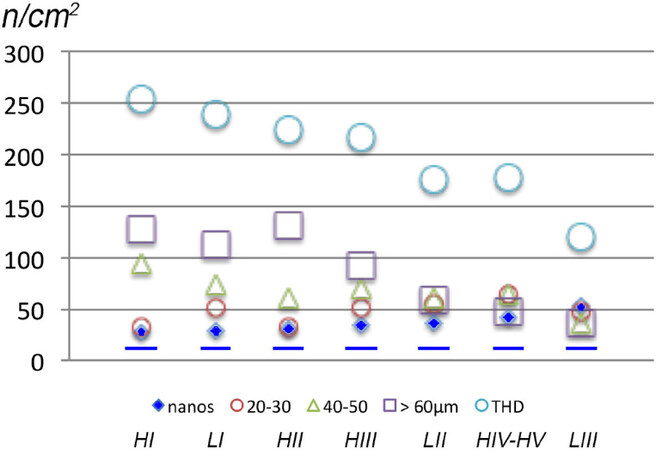
Figure 4. Hair densities in female and male patients with pattern hair loss (PHL). Hair density (n/cm2) allows a rather static description of a dynamic process in PHL. Hair counts were established with our phototrichogram in PHL, respectively, Ludwig (females, LI-LIII) and Hamilton (males, HI-HV). Patients were ranked by decreasing THD (large open circles), and all differences of THD within gender were statistically significantly different. Accordingly, the rank was HI, LI, HII, HIII, LII, HIV/HV and LIII. where the gradual reduction in THD reflects the severest chronic regression. We draw attention to the fact that LII and HIV/HV show equal total hair density. The gradual decrease in hair density after splitting into a range of diameter categories illustrates that the main contributor to decreased total hair density is terminal hair (open squares). While intermediate (open green triangles) appears quite dense in HI males, hair thinning (open red small circles) does not compensate hair density with increasing severity of PHL. This most likely reflects extended empty follicles between cycles. Finally, in the most severely affected patients (LII, HIV-HV or LIII), the hair fibre densities spread almost equally into the three thickness categories: terminal, intermediate and vellus-like hairs. The average density of nanohair (< 20 µm; small plain blue diamonds) in PHL always exceeded the 95th percentile value of healthy controls independently of gender or severity, as shown by the dotted blue line at the bottom. The density of nanohair appears as a new sensitive and specific diagnostic parameter in patients complaining of hair loss. As far as PHL is concerned (with the notable exception of HI), it is statistically significantly increased in all patient groups either female or male [Tables 1 and 2]. THD: total hair density.
The detailed statistically significant differences between patients and controls appear in Table 1 for hair counts and Table 2 for data distribution in patients vs. controls (5th and 95th percentiles).
With the notable exception of the “No-pattern” subgroup where increased terminal hair densities were found as compared with controls, female patients collectively show decreased intermediate-terminal hair with an almost systematic and statistically significantly rise in nanohair density. While average density of thinnest hair in female patients was increased (nanohair), other thinning hair such as 20 µm appeared almost unaffected and the 30 µm and 40 µm and total hair densities were equal or even lower in patients. As compared with gender-matched controls, the increase in nanohair in male patients with moderately severe patterning mirrored the decrease of terminal hair (≥ 60 µm) and total hair densities.
The distribution of data is important for clinicians to consider, and it is of note that no patient had less nanohair as compared with their gender-matched control group while 50% or more showed higher counts of nanohair than controls.
Amazingly, a kind of mirror image is found in total hair density (last column) where lower densities were found in the majority of patients vs. controls. The percentages of patients also give a hint to clinicians in terms of parameters that might be useful discriminants. Although static in essence, calibrated hair counts already reflects dynamic that reflect shortened anagen duration and prolonged emptiness after exogen release, as shown in Table 3.
Dynamic parameters
Growing and resting hair counts
Tables 3 and 4 show dynamic parameters such as absolute densities of anagen and telogen. Anagen but not telogen densities were statistically significantly reduced in patients as compared with gender-matched controls.
In females, we found a notable exception to this in the “No-pattern” group with normal anagen hair in the thickest intermediate hair category (≥ 50 µm).
Even when telogen density showed globally significant differences, the spread of values was such that no subgroup differed statistically significantly from controls.
Similarly, exogen hair density was found to be increased vs. controls only in the most severely affected patients.
In males, the variations appeared similar to those observed in females with densities of growing or anagen much more impacted than telogen hair densities.
Table 4 confirms that, independently from gender, terminal anagen density (≥ 50 µm) regresses substantially in the majority of patients with PHL (around 75% of females from severity LII or of males from HIII).
The normal distribution of terminal hair (anagen and telogen) in the female NoP and LI groups contrasts with lowered anagen per cent when thinner hairs were included (anagen ≥ 20 µm; more subjects below P05 of controls).
This combination reflects regression in terms of growth along with the reduction in hair diameter and contributes to the perceived reduction of the mass of scalp hair.
The comments in FPHL apply generally to MPHL where the regression of follicular dynamics explains the static data and documents shortened anagen and prolonged emptiness after exogen release, all contributing to decreased follicular performances.
The linear growth rate during progression of hair loss warrants a closer view as in any chronic regressive disorders ageing might contribute by itself.
Hair productivity
The details on statistically significant differences between patients and controls are presented in Table 5 (absolute data) and Table 6 (Percentiles) with the more sophisticated and complex computations in the five last columns. The percentage of anagen hair (A6%) was reduced in more severely affected females LII and LIII for the finest hair (20-30 µm and 40-50 µm). In all female patients, the LHGR of intermediate hair with diameters 40-50 µm was significantly reduced vs. controls.
The absolute productivity of thinner and intermediate hair (20-30 µm and 40-50 µm) was lower in all female patient groups as compared with controls. Productivity (CIHG area %/day) of terminal hair in female patients without a clear pattern (Other) and in the less severely affected LI group was almost equal to controls, while it exceeded control values in the No-pattern group. The global productivity (CIHG Tot) was in the normal range for the NoP group while significantly reduced in patients classified as “Other” as well as in the LII and LIII subgroups in correlation with increased time to complete coverage.
In MPHL, there was a shift from decreased productivity of terminal hair towards increased productivity of thinner hair as compared to controls. This compensation was inefficient in terms of global productivity (CIHG Tot) that significantly reduced along with increased severity, i.e., from HII to HV. This matches with an extremely prolonged duration of the time to complete coverage and most likely reflects the gradual involvement of the ROI by the regression process. Independently from gender, over 70% of patients stayed beyond P05 threshold for positive parameters of growth (CIHG Tot) and went beyond P95 for time to complete coverage (female LII, LIII and “Other” and male HIII-HV) all in relation with regression of follicular performances. In addition, when the per cent anagen drops below 60%, which means that the maximum length of the hair produced would probably remain shorter than 3 cm, the contribution to coverage and mass of scalp hair becomes negligible with decreased coverage as displayed in [Table 7]. This hypothesis implies that growth rates would remain constant during hair loss and throughout lifespan. Therefore, we investigated the role of ageing on follicular performance.
The global ANOVA on age found MPHL with higher severity to be significantly older than less affected ones (P = 0.0004). There were no significant age differences in female groups (independently of the presence PHL). While age was generally not a major factor of variation in most parameters, some degree of regression was unravelled, as shown in Figure 5. The detailed results of statistical analysis are displayed in [Table 8]. The follicular productivity or CIHG results from the following operation: number of growing hair per unit area × LHGR × Diameter [area in µm2/(cm2 × 24 h)]. Provided that one exhaustively probes all productive follicular units in the outlined scalp surface, CIHG can easily be converted into scalp covered by hair, i.e., area %/day, before its final translation into TTCC, as shown in the last two columns of Tables 5 and 6. It is clear from the latter that the arithmetic interval between two adjacent clinical categories (i.e., 1) varies widely according to gender and severity. TTCC documents unequal intervals with a few examples: TTCC between LII and LIII (88.79-50.26 = 38.53 days) is almost double the difference between LI and LII (50.26-28.95 = 21.31 days), and similarly HIV and HV (119.9-68.75 = 51.15 days) differs greatly from HIII and HII (44.7-28.11 = 16.59 days). In short, based on classes and independently of gender, an equal difference of one grade in clinical classification would arithmetically mean that 16.59 = 21.31 = 38.53 = 51.15; i.e., if 1 ≠ 1, we practice fancy arithmetic.
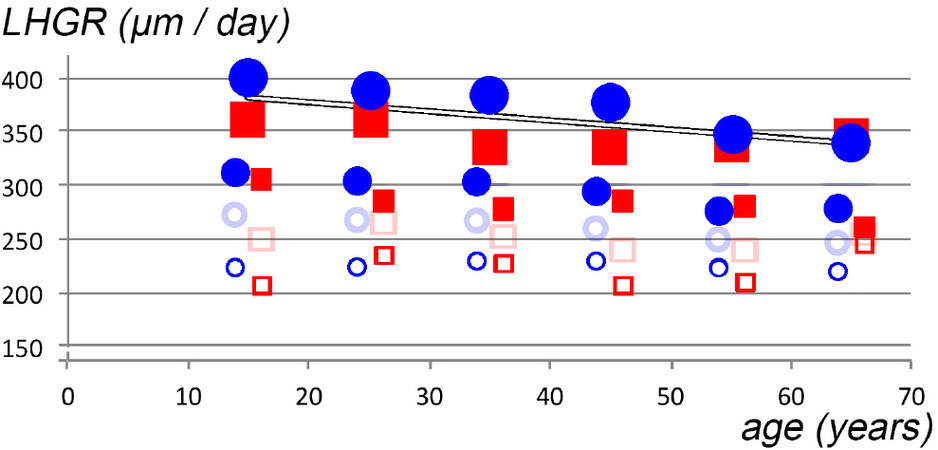
Figure 5. Linear growth rates according to hair diameter and gender along with ageing in patients complaining of hair loss. Age is shown on the x-axis (years) and growth rates on the y-axis (LHGR, µm/day; scale from 150-400 µm/day). Female data appear as circles while male data are symbolised by squares. The symbols for genders apply in this figure whatever the diameter of hair fibres category and the same gender-symbols are also used in Figures 8 and 9. The largest plain symbols represent terminal hair (diameter ≥ 60 µm), smaller plain symbols represent thinning intermediate hair (diameter 40 µm) and smaller empty symbols are for the thinnest hair (paler print 30 µm and more contrasted 20 µm). The average LHGR of 50 µm diameter are not shown in this figure as data caused substantial amount of overlap. Detailed statistical values on age interacting with clinical classification on hair dynamics are given in Table 8. The diameter of the hair fibre exerts a major statistically significant influence on the daily growth rate. Whatever the age, the terminal hair clearly grew more quickly than the thinner intermediate hair (larger and smaller plain symbols, respectively) and all miniaturising hair (open symbols). However, with increasing age, the relative difference became gradually less marked. The statistically significant linear regression for the terminal hair vs. age appears, after combination of data for both genders, as shown by the line across the larger plain symbols. The pure effect of ageing cannot be separated from longstanding exposure to the noxious mechanisms responsible for the regression process. LHGR: Linear hair growth rate.
Finally, let us focus again on the SCS data gathered by the clinical observer. SCS appeared, during this cross-sectional study (absolute SCS and its relative per cent to the maximum) together with the percentiles outside the normal limits [Table 7] to perfectly fit with diagnostics in dermatology clinics. On top, it is obvious (last column midline parted hair; < P05) that a high proportion of patients with lowered SCS allowed a clinical observer to quantify objectively a subjective complaint of hair loss.
At least 80% of patients (all groups except females NoP) had an abnormally low SCS value on midline parted hair. When the same was tested exclusively in groups of patients, there were 8/10 possible comparisons in females and 3/3 possible comparisons in males [last columns in Table 8: highlighted fields TOP ≥ 7 in females and TOP ≥ 2 in males]. This means that a global score would not differentiate between female patients between LI and Other or NoP and Other.
This also leads to the observation that SCS on the top of the head with hair parted along the midline is perfectly complementary to the simplest clinical classification. However, quantitative information comes in addition to pattern selection (as some patients have no pattern), a clinical benefit by objective estimation of the patient.
The most global analytical parameter, TTCC (the shorter the better), and the consistent scalp coverage scoring after mid-parting of hair (SCS; the higher the better) nicely fitted clinical classifications. By correlation-regression between the two most representative analytical parameters, we generated an abacus that translates clinical scores into productivity and vice versa.
Before beginning the detailed analysis of observer vs. self-estimation and correlation study between SCS and hair productivity, we present the results obtained with computer graphics. We simulated the degree of difficulty to observe scalp skin through the hair, with the highest difficulty score represented by black (5) to the lightest shown as white (0). The averages and statistically significant differences translated from data in Tables 7 and 8 are shown as a visual chart for top of the head fields before and after midline parting [Figure 6].
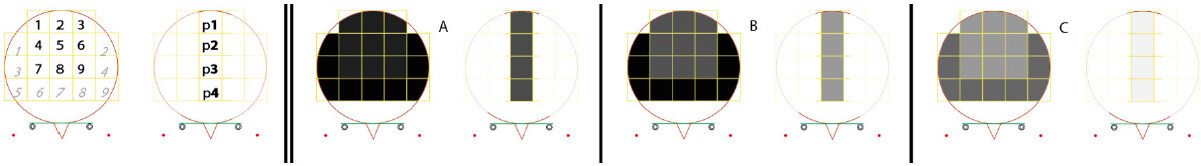
Figure 6. Computer simulation of patterns based on scalp coverage scoring (SCS) in patients complaining of hair loss. Figure 6 (left of vertical double bar) shows fields known as top and vertex, frontal and lateral or midline-parted (groups of numbered squares as detailed in earlier section). The sum of SCS in each field mathematically documents coverage and is tested statistically by comparing the SCS in a clinical group vs. a theoretical maximum score. If a field contains nine squares, then 9 × 5, i.e., 45, is the maximum attainable score (100%) while the parted-midline maximum is 4 × 5 = 20 (100%). Intermediate sum of scores would translate relatively speaking into grey shades in this artistic representation. As detailed in Tables 7 and 8 (SCS relative per cent of maximum), there were statistically significant differences in SCS values between patients in these fields. For a clinical correlation, we typically refer the reader to Figure 1 where sum SCS 100% would easily be reached in the top-vertex or lateral-crown fields by the two subjects appearing on the left [Figure 1E; HI]. On the contrary, the 2 probands appearing on the right would be closer to 10%-20% (HIV and HV) with “no difficulty observing scalp skin through the hair”. For females, we refer to clinical images shown in Figure 2. The images in the two top rows clearly illustrate that scalp skin is less easily visible in NoP, LI or Other [analogous to Figure 6A] than in LII [analogous to Figure 6B] or LIII [analogous to Figure 6C]. Of note is that the crown becomes involved in Figure 6C, i.e., in the most severely affected subjects. Comparing density in each paired left and right diagrams in these three panels [Figure 6A-C], it is clear that midline parting displays lighter grey levels. Lower SCS scores mean that combing the hair apart unravels a decreased coverage on the top-vertex on the crown, especially in the most severe cases [Figure 6B and C].
Global approaches: self-estimates of hair loss, clinician’s classifications and SCS.
Before discussing the field of perception, it is worth mentioning that, in our hands, gentle pulling on clean scalp rarely exceeded five hairs (one patient with LIII and one subject with HIV).
This probably reflects a small number of patients facing an unnoticed sudden acceleration phase amidst the more chronic rather slowly regressing disorder or less compliant patients, i.e., no shampoo on the day of clinical visit.
Self-estimates of hair loss
The self-estimated scalp hair status was written down in the questionnaire by the patient during the clinical visits. The scores diverged frequently from the clinical observer, as shown in Figure 7.
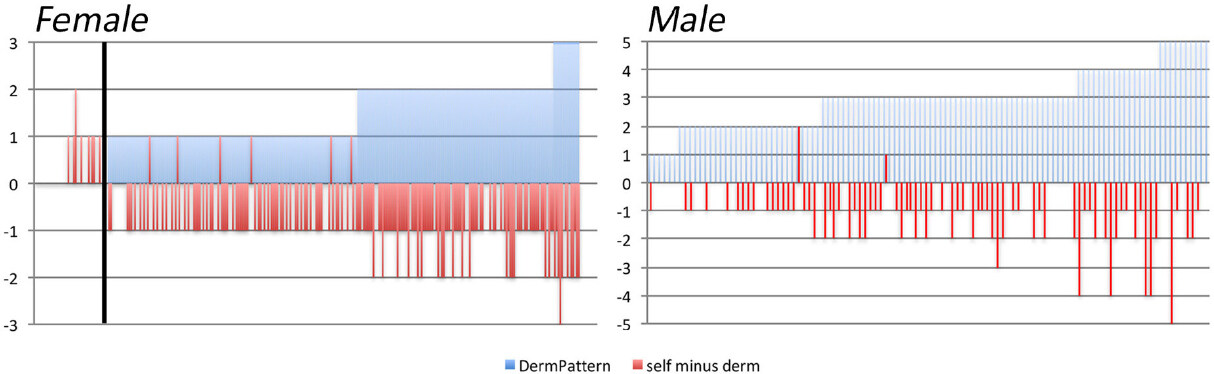
Figure 7. Self-estimated severity scores by patients complaining of hair loss versus clinician’s estimates of pattern and severity. Female and male patients appear, respectively, in the left and right panels. All patients received the questionnaires and cartoons on their first visit to the clinic. They were not given any assistance during the reporting to be returned at the second visit. This prevents undue interferences between observer and patient evaluations. From the initial 304 females, we retrieved 294 duly completed files. From the initial 110 males, self-scoring documents were lacking for four subjects, thus 106 were retained. The other questionnaires were considered as lost to follow-up. The dermatologist’s classification appears as “DermPattern” in the shaded areas (blue) while the “self minus derm” (red bars) reflect the differences between patient’s self-estimated classification and the clinical severity attributed by the dermatologist. Positive bars indicate overestimation while negative bars indicate underestimation by patients as compared with the dermatologist’s evaluation. In the pool of 294 females who completed the self-administered questionnaire, there is no apparent surface when dermatologist found no pattern (cases on the left side of the vertical bar; no pattern (NoP) scored as 0). The cases on the right side of the vertical bar appear as positive shaded areas (light blue) reaching up to 1, 2 or 3 (scale from -3 to +3; y-axis) for females with a Ludwig pattern rated as LI, LII or LIII, respectively. Only 5% of the pool of 294 females (14 occurrences in total; eight in NoP and six in LI) overestimated their condition and attributed a more severe score. Complete agreement between subjective estimates by females and clinician was recorded in 38% of females while underestimation occurred in 57% of the female patients (167 cases; one grade for 140 subjects and two grades for 27 subjects). Similarly, in males (all pattern hair loss; scale from -5 to +5), only 2.5% overestimated the severity (one HII by two grades and one HIII by one grade), while 85% and 72% of HIV and HV, respectively, underestimated the clinical class attributed by the investigator.
Contrary to the often-held opinion on patients exaggerating the phenomenon of hair loss, we observed the great majority of subjects underestimated the severity.
SCS cross-sectional study correlates with scalp hair productivity
The scalp target for non-invasive functional investigations or ROI was chosen after obtaining agreement of the patient, at a distance from the most severely affected sites, e.g., remote from the epicentre or at the progression edge of the balding process.
With SCS, in the least severe cases, typically in females NoP and LI or males HI and HII, we know that the clinician was unable to quantify hair loss, as illustrated in Figure 7, albeit most patients already showed increased counts of nanohair [as shown in Figure 4 and detailed in Tables 1-8.
The abacus in Figure 8 displays all data from 414 individual patients and 90 controls. For completeness, the dispersion of data around the average is shown separately for females and males in Figure 9. HMI abacus derives follicular performance from clinical rating of the “difficulty to detect scalp skin in between hair”.
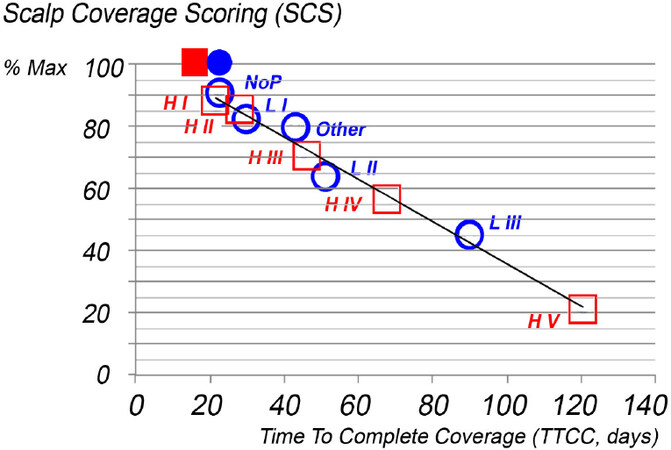
Figure 8. Hair mass index (HMI) abacus translates clinical pattern and severity (SCS on parted midline) into dynamics of hair regression (TTCC). The scalp coverage scoring performed on the hair parted on the midline is shown relative to the maximum attainable score (y-axis; SCS per cent of maximum) as it correlates with our most synthetic parameter: TTCC (x-axis; days). The latter was obtained after conversion of daily scalp hair productivity (compound index of hair growth area percentage) in the dimension “time”. Circles and squares symbolise females and males, respectively. Plain blue circle and square reflect the maximum values found in healthy controls (y = 97% and x = 21.6 and 19.6 days in female and male controls, respectively) followed by empty symbols for averages found in patient groups split into classes according to pattern and severity by the observer. Neither TTCC nor SCS on parted midline in the least affected patients (NoP, LI, HI and HII) can discriminate patients from healthy gender-matched controls. The x-y intercept and linear correlation coefficient (y = 106.41-0.72x; R² = 0.973) confirm mathematically that the clinician did an acceptable job in terms of classification as well as in estimating SCS. The HMI abacus reflects a compound measure based on TTCC and SCS, albeit potentially not exempt from “classification errors”. Statistical approaches help clinicians to deal with the error associated with most - if not all - measurements. Instead of “jumping by chance” from one class to another because of the binary nature of the scales proposed by Ludwig and Hamilton, HMI is a continuum, and the dispersion of data around the average is detailed for each gender separately in Figure 9. NoP: no pattern.
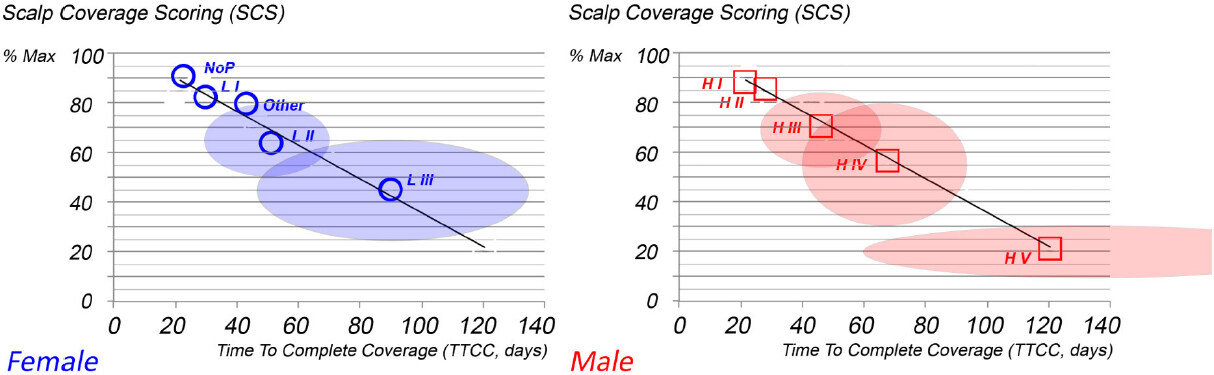
Figure 9. Dispersion of data around the hair mass index abacus in patterned hair loss (PHL). The dispersion of healthy data is such that females with no pattern (NoP), LI and HI and males with HI-HII cannot be distinguished statistically significantly from control averages in terms of either coverage or hair productivity (TTCC). In female pattern hair loss (FPHL), dispersion of data around the averages, i.e., standard deviation (along both axes), shows very little overlap between SCS and TTCC (LII and LIII). When the clinician was uncertain and classified patients as “Other”, the abacus confirms an intermediate position (dispersion not shown). Clinical classification makes sense and SCS regressed linearly from LI to LIII with “Other” hair loss in between due to less marked patterning. The regression line equation in females y = 107.58-0.7336 (R² = 0.94) implies that analytical and global methods work well together. Similarly, in males, y = 105.31-0.71 (R² = 0.99), time to complete coverage also worsened as severity increased, but there is a substantial overlap between HIII and HIV. The asymmetrical spread of data around the averages along the two axes deserves a clinically relevant comment. Graphs clearly show that, instead of circles (equal dispersion of SD on x and y axes), we found ellipses (shown as paler fields around the averages). Wider dispersion along the x-axis generates asymmetry, suggesting that the region of interest (ROI) was sometimes more and sometimes less affected by hair regression with the ROI more remote from or closer to the epicentre. As SCS focussed on maximum severity with parted hair along the midline, the relative dispersion is less as compared with time to complete coverage. These findings suggest that the abacus makes sense and might be considered for clinical use.
As illustrated by the computer simulation of SCS [Figure 6], SCS with the hairstyling procedures refines Ludwig’s or Hamilton’s classification, especially as the more peripheral anterior-crown fields become involved. When SCS on the parted midline is displayed against a very precise measure of hair productivity, a statistically significant linear correlation was found with intertwined female and male patients with or without pattern; all averages were found along the same line. This strongly supports the practical value of the innovative abacus [Figures 8 and 9], implying that, when properly applied, the HMI method might substantially improve communication between professionals (practitioners or nurses and technicians working in hair clinics) and their patients.
The clinical classification, e.g., Ludwig or Hamilton, makes sense and in our practice the cartoons [Figure 1] are kept as the first level of information. SCS comes second together with our phototrichogram-generated data. In the case clinical scoring is the only accessible method, the abacus helps the duly trained clinician to translate his own estimate of scalp coverage into productivity, i.e., time to complete coverage. In short, all components support the proposed HMI approach.
SCS longitudinal studies detect improved hair productivity
In the absence of statistically significant changes of hair productivity, as documented through our phototrichogram study (unpublished data), 81 SCS were performed with global images viewed on the computer screen. SCS values remained stable (three times on 27 subjects during a six-month study; data not shown). Relative SCS variation between baseline, Month 3 and Month 6 was 1.21% (SD: 9%), i.e., not statistically significant. The consistency of our phototrichogram and SCS findings was an important step in considering the clinical value not only before engaging in larger-scale cross-sectional transversal studies but also before challenging the HMI abacus concept with longitudinal studies.
We now proceed with challenges of SCS method in longitudinal follow-up studies where fast changes of hair dynamics occur. By analogy with seasonal fluctuations of daylight, there may be a three-month delay between precisely measured units of time and perceivable events. We all learned by aesthesis that duration of daylight increases after Winter solstice in the northern hemisphere while temperatures lag behind and can still get lower until raising again in the spring.
With scalp hair, the initial upsurge of minoxidil-induced hair growth was followed by measurable growth arrest during the weaning of minoxidil. Global perception of loss stays behind for about three months, as illustrated in Figure 10.
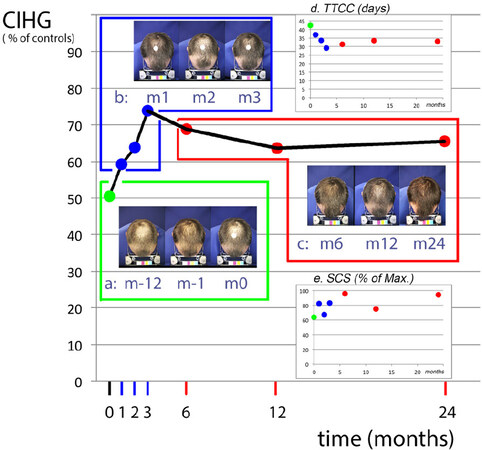
Figure 10. Challenging hair mass index (HMI) abacus in male pattern hair loss (MPHL) during fluctuating hair productivity associated with drug treatment. All graphs display the time points on the x-axis (time in months). Baseline [from month -12 (m-12) to month -1 and month 0 (m-1 and m0)] was followed by the monitoring of drug-induced effects according to study protocol at selected time points [1, 2, 3, 6, 12 and 24 months (m)]. The scales (y-axis) on the main graph represent fluctuations of hair productivity measured in one male subject with MPHL [compound Index for hair growth per cent of controls (CIHG%)]. Inserts (a-c) show the top of the head viewed one year and one month before and at m0, i.e., at entry into the drug trial (a, green outline; m-12, m-1 and m0). Global views were documented at monthly intervals along with the combined oral and topical drug treatment (b, blue outline; m1, m2 and m3). This was followed by the last three visits starting three months after arrest of topical lotion, i.e., during the oral drug only (c, red outline; m6, m12 and m24). All measured hair variables recorded during these three successive timeslots are shown using the same colour codes, i.e., baseline in green, combined drugs in blue and oral finasteride only in red. On the y-axis, besides productivity (CIHG% of controls), the two smaller inserts (d, e) show the TTCC (days) and SCS (per cent of maximum). In the latter, each dot is the average of triplicate scoring viewed one at a time from three series of randomised source images. The baseline (green dot) shows average SCS on images recorded during the one year before inclusion, while blue dots are SCS on combined drugs and red dots on oral drug only. It is understood that a decreased TTCC means improved hair follicle performance. The values dropped below 30 days on their way to normalisation of time to complete coverage, i.e., 19.62 days. Maximum improvement was observed at m3, the time-point where topical minoxidil applications were about to be interrupted according to protocol. All data points perfectly match with one another except for time-points m2 and m6: (1) SCS significantly drops at m2 [blue dot at m2 in (e)] while analytical measures document improved hair growth. Shifted SCS highlights the transient effects of intervention of the hairdresser {one month later impact on SCS almost vanished [m3 in (e)]}. (2) SCS slightly improves at m6 as compared with m3 when the actual indicators of growth worsened. This reflects a delay of perception of hair cycling by the clinician and most probably a delayed hair cut with more efficient coverage due to cumulative effect. During the first three months, the combined drug regimen almost normalised hair growth but subsequent transition of anagen into catagen-telogen occurred, albeit an apparently stable mass of hair. After completion of telogen and shedding of exogen, i.e., after m6, there was a decrease of SCS at m12 and partial recovery at m24, which reflects maintenance of hair regrowth with long-term oral drug intake. Hence, SCS and hair productivity fluctuate with an immediate correlation when cycling improves and with a trimester delay when cycling arrests; this is consistent and is in line with follicle pharmacodynamics. SCS: scalp coverage scoring; TTCC: Time To Complete Coverage; CIHG: compound index of hair growth.
Tracking of improvement of hair follicle productivity
To approach the fundamental question “where did the hair come from?”, we performed the painstaking task of individual hair growth monitoring. We secured a population of hair follicles where all and any individual hairs appearing at the surface of a well-defined scalp field are identified.
Our phototrichogram method allows a precise follow-up of hair replacement, but, for correct interpretation, a probabilistic plan was required and we deliver herein the details of this innovative approach [Figures 11 and 12]. From previous studies, we knew that fully active follicular units in that particular individual may produce 3-7 hairs[12,17,23] separated occasionally by long quiescent phases with no visible hair at the scalp surface. In addition, regrowth may be heralded by accelerated hair shedding followed in soon time by the appearance of fine tips of new hair at the scalp surface. This is through substantial shortening of the empty or lag phase as compared with the natural progression of PHL in the absence of drug treatment. From the dynamics perspective we estimated that being for 3 years on finasteride the growth would be maintained in a steady-state situation. These data and Figures 11 and 12 are subject to a speculative proposal, i.e., one that tackles the question of predictive value of baseline characteristics of well-defined follicular unts in terms of therapeutic responses [Supplement File 3].
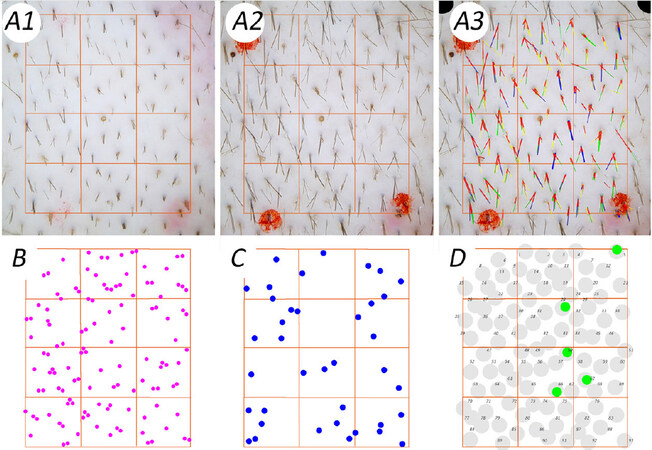
Figure 11. Demonstration of improved hair follicle productivity in male pattern hair loss during combined oral and topical drug treatment. Figure 11A1-A3 provides detailed views generated by our phototrichogram method. The image appearing in Figure 11A1 was captured immediately after clipping and Figure 11A2 shows the same site 48 h later. The perfect overlay of Figure 11A2 on Figure 11A1 in Figure 11A3 is ready for Computer-Assisted Image Analysis after technicians used a panel of colours that have no specific meaning in terms of growth rate or diameter at this stage. The novel method introduced specific colour codes for identifying growing hair to be dot-mapped. Accordingly, “growth” is shown for the thinnest diameters [Figure 11B; magenta; 20-30 µm], intermediate [Figure 11C; blue; 40-50 µm] and terminal hair fibres [Figure 11D; green; 60-70 µm]. We planned yellow as colour code for growing hair with a diameter exceeding 80 µm, but no such hair was present at baseline. The second innovation appears as grey dots as the background. This procedure exhaustively identified follicular openings to allow a precise description of hair productivity per follicular unit (FU). By back and forth examination through all images from d-8 to d90, we found 93 FU mapped in Figure 11D [follicular unit dots (FUD)]. All FUD were numbered for creating a repertoire during the longitudinal study [larger and paler dots in Figure 11D]. Typically, at this baseline session, we detected five growing terminal hair pertaining to FUDs 5, 28, 50, 62 and 66.
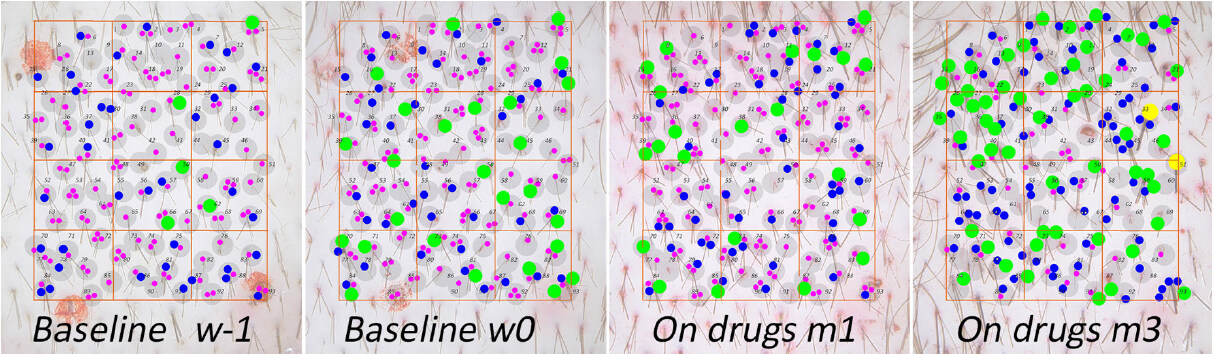
Figure 12. Demonstration of improved hair follicle productivity in male pattern hair loss (MPHL) during combined oral and topical drug treatment. Each growing hair on a scalp site of the test subject was dot-mapped on repeat-phototrichogram images according to a sophisticated procedure detailed in the legend of Figure 11B-D. While fluctuating short-lived intermediate and terminal hair growth was present at baseline (compare w-1 and w0), rapid induction of cycling with rapid wash-out of short-lived follicles and new growth occurred within one month of topical minoxidil (On drugs m1). Many disappeared at m3 (On drugs m3), indicating that total length reached by such short-lived fibres would not exceed 1 cm. If one focuses on terminal hair only (green dots), it is probable that, from the five terminal hairs present at w-1, only two [follicular unit dots (FUDs) 5 and 28] remain until m3. The three others (FUDs 50, 62 and 66) exit either spontaneously or as the result of a spontaneous entry into telogen at w0 or premature cycle termination, i.e., a wash-out effect of minoxidil in terminal but short-lived follicles at m1. The “on drugs” period showed rapid hair replacement at m1 with improved growth (disappearing and appearing dots illustrate changes associated with combined “diameter” and “growth rate”). The sustained regrowth of terminal hair with maintenance of growth at m3 in 45 of the 49 hairs present at m1 suggests a more relevant effect of minoxidil. Statistically, the average baseline 178 growing hairs were dispatched based on diameter into 123, 39 and 16 growing thinner, intermediate and terminal hairs, respectively. These total growing hair counts changed to 201 at m1 (+ 14%) and 171 at m3 (- 3%) as an effect of minoxidil applications. The different categories of hair (as percentages of baseline) also shifted + 7%, + 27% and + 35% at m1 and - 63%, + 87% and + 235% at m3 for thinner, intermediate and terminal hair, respectively. The 2 thickest terminal hairs at m3 (diameter ≥ 80 µm) raised from very low density FU hosting most probably some empty follicles at baseline. Multiple fibres sprouting from a single hair follicle characterised this individual’s drug response. The blue and green dots total four or five hairs in FUs 45, 59, 63 and 93. Looking in detail at the same FUs in the 2 baseline images, rapidly on-going hair cycle fluctuations are obvious in the absence of topical treatment. This may range from growth to rest and exogen release in thinner follicles while, at the same time, other follicles from the same FU progress from Anagen 5 (hair in the follicle but still underneath the scalp surface) into initial steps of Anagen 6 with more than one intermediate/terminal hair visible at the surface. Interestingly, a significant proportion of those “baseline” intermediate and terminal hairs vanished already at m1. This documents very short cycling units that come along with an upsurge of thinner tips. The latter arose from intermediate or terminal follicles as they grew already at high speed (precise LHGR not shown), which reflects the earliest steps of re-initiation of productivity from pre-existing but resting/dormant follicles still capable of producing intermediate or terminal hairs. For a very detailed study showing combined LHGR and diameters during initiation of anagen, please read the previous report in[13]. A preliminary predictive value was suggested as hair/FU that contained 2-3 fibres at baseline were able to contain 4-5 hairs at m3 while FUs bearing fewer than two fibres remained stable or grew less hair (more details on that topic are presented in Supplement File 3; confirmed by ANOVA). Figure 12 demonstrates 3 neglected facts about scalp hair cycling: (1) A biological potential from resting and/or empty terminal hair follicles was present in the scalp at baseline. (2) Those roots and the associated growth potential were not unravelled during a six-month LASER-comb application. And (3) There is no hard evidence for miniaturised follicles to massively transform into intermediate or terminal hair productive units as the result of an efficient drug treatment. The statistical record and speculations on predictive value of combined parameters at baseline are detailed in Supplement File 3.
Discussion
Our research data must be understood in the global context of aesthetics as it relates to aesthesis. This means perception by any sensitive system. Therefore, we put our methods and data in line with independent reviews on this topic[24]. Accordingly, global imaging was advised in conjunction with our phototrichogram, an approach quoted as “the most sensitive methodology” for PHL, a condition characterised by hair follicle miniaturisation with finer and less pigmented hair in specific fields of the scalp[21]. Our clinical approach with a more global method was conceived at the end of the 20th century: the theoretical background was to imagine a method that would encompass any dimension related to “hair quality”. The patented SCS concept (EP1392166A1) appeared equally effective in detecting clinically meaningful regrowth as compared with FDA approved expert scoring system[18] with paired before-after pictures. During SCS, images are viewed one at a time, which allowed randomisation wiping away a frequently underestimated risk of bias, i.e., dimension “time”.
From our cross-sectional study, SCS quantifies a continuum and linearly correlates the perceived hair loss phenotype with increased TTCC and with reduced hair follicle productivity independently from gender and/or presence or absence of a pattern. The method refines clinical perception as it always measures the same scalp sites in a given subject by mastering variations in scalp geometry. The topographical coordinates and precise geometry are usually not taken into account by other classification systems. The attempts made to corroborate the Sinclair’s scale with qualitative trichoscopy[25] did not investigate healthy controls, and we acknowledge that the scale in six grades took advantage of midline parting, a robust way to control hairstyle[26]. It offers clinicians the advantage of focussing the attention of the epicentre of alopecia, as confirmed herein by SCS.
In our investigation, we found low variation in SCS as the clinician concentrates on the worst affected sites contrary to the detailed analytical procedure. This is not a major drawback, as it helps to highlight the earliest possible events taking place in the hair follicle, eventually before the scalp site becomes involved in the balding process.
At the other extreme of analytical variation, one should be aware that time to complete coverage may extend beyond reasonable therapeutic expectations: How could we revert growth in a site where time to complete coverage would be longer than 180 days? Such extremely remote targets might become future objectives with local modulators of gene expression, as available drugs will probably not improve these most severe situations. While exploring innovative therapeutic avenues, one might consider the hypothesis that microenvironmental changes in the hypo-dermal layers of the scalp of some inhibitory factors lead to a refractory stage[27]. Accordingly, anagen follicles may be prematurely precipitated into telogen but do not re-cycle immediately[23,28]. After exogen release, they are refrained to re-enter into growth, a lag phase also referred to as kenogen[29]. A major question remains to be answered: What is the point of no-return on the path of follicular regression?
From a methodological perspective, future research campaigns aiming at prediction of severity in MPHL[30] might benefit from using objective rulers such as SCS, as we know from our self-estimation study that patients frequently underestimate severity of their condition. The projection into a drawing does not decrease the psycho-social suffering and patients usually notice that they modify their behaviour to cope with the condition in published studies[1-3] and in our personal unpublished files. As illustrated previously[10], we acknowledge that objective SCS and analytical methods provide a totally different type of information than the complex subjective evaluation by patients’ satisfaction with hair changes with treatment: in medical offices, we have to deal with optimists and pessimists[10,15] and objectivity may temper the negative feelings on both sides (patient and doctor).
Whenever detailed information on hair follicle function would be required, we repeatedly advised to use the most refined imaging procedures because fast and easy tools[31] may not reliably document hair productivity. In line with this proposal, we discuss in greater detail one clinical study - a combination of drug intake and surgery - as it is perfectly in line with the purpose of aesthesis and challenges of combined global and analytical approach. Similar to others[32], we were puzzled by results of hair counts established before and after scalp hair follicle transplantation where transplanted subjects on oral placebo during 12 months showed decreased hair counts as compared to baseline. In contrast, transplantation with 12 months on oral finasteride generated statistically significant hair regrowth[33]. The authors of the Evidence based S3 (further EBS3) review commented the situation as follows: “mean change from baseline total hair count at 12 months was 18.5 hairs/cm2 (12.6%) and - 13.5 hairs/cm2 (- 8.9%) respectively (P = 0.019)”. The same review pursued with “On frontal-superior global photography, 67% of patients improved and 30% did not improve after hair transplantation alone, vs. 94% and 6% after combination therapy, respectively”, in finasteride treated group vs. controls. The EBS3 expert reviewers commented that there appeared to be a considerably higher efficacy than previously reported in other studies with finasteride alone. The EBS3 report concluded that “The differing results of hair counts and frontal-superior global photography in hair transplantation alone may partly be due to replacement and compensation of miniaturising hairs by thicker permanent hair from the occipital area. Magnification should be used when making recipient sites in-between pre-existing hairs.”
The elliptical spread of our data around the averages in our HMI abacus is a mathematic illustration of this EBS3-experts questioning. Therefore, our approach with phototrichograms and SCS on parted hair and the exact relocation of the ROI seems critically important, as the former may explore from yet unaffected sites to seriously affected scalp fields, while the latter focuses on the epicentre. SCS applies whatever gender and pattern, can be performed in the clinic and does not require special optics or complicated mathematical calculations: the HMI abacus allows a rapid translation of the clinical estimates of coverage (SCS) into productivity and time to complete coverage. In the case of a drastic haircut or shaving that may prevent appropriate SCS evaluation[10], staying away from the hair-dresser’s booth for one month was sufficient to cover scalp again and perform a valid clinical estimation of coverage. This importantly underscores that time to complete coverage matches SCS.
Scalp hair maturation and ageing in itself pertains to fundamental questions. Scientists acquainted with hair measurements might estimate that our healthy controls had many finer hairs. The fact is that the Belgian population is extremely heterogeneous. Migrations with centuries of invasions and warriors from southern, northern, eastern and western countries must have left some genetic markers. In controls, finer hair grew in higher proportions and at a faster rate than most of the affected patients. Productivity of the finest hair remains a small fraction of global hair productivity, and it was found to vary in patients. We suggest that the hair follicles of our young control subjects may still be on the way towards scalp hair maturation. We speculate that a high density of small silos with a low load on the general metabolic balance might have some biological advantage in terms of stem cell reservoirs. Future research on gender-related maturation might help discover whether these small units are potential for future terminal hair or not.
Ageing in females remains an interesting question as previous studies[26] involving 564 “normal” participants reported frontal and fronto-parietal recessions in 13% of premenopausal and 37% of postmenopausal females. The SCS in our study showed a significant decrease in lateral-crown areas under the influence of age [for details, see Table 7], although age by itself was not a major causative factor of regression except for linear hair growth, which is probably more difficult to appraise during a clinical consultation.
The theory of “reversibility of hair follicle miniaturisation” put forward to explain the effects of drugs warrants some clarification. Biopsy studies during placebo-controlled finasteride trials reported 1203 miniaturised hair follicles in males and 1966 in females[34]. The absolute decrease of miniaturised follicles ranged from - 3.1 to - 1 per biopsy in males and - 2.3 to - 1.6 per biopsy in females after 12 months intake of finasteride or placebo, respectively. Within the same timeframe and treatment groups, counts of terminal follicles showed + 5.4 vs. + 1 in males in the finasteride and placebo groups. These statistically significantly increased numbers in finasteride-treated males contrast with females showing no statistically significant changes from baseline with + 0.1 and + 1 terminal hair follicles, respectively, in the finasteride and placebo groups. Obviously, increases in terminal follicle counts exceeded by far the reduction of vellus-like hair follicles. Our interpretation is that several follicles remain difficult to identify precisely with current technologies on scalp biopsies. Nevertheless, the hypothesis derived from this approach became quite popular[34,35] while most contemporary studies casted some doubts on the diagnostic value of hair counts derived from such an invasive procedure[36].
It should be acknowledged that sample size analysed by biopsies remained substantially smaller than miniaturised hair samples studied by less invasive approaches. Accordingly, invasive sample size reached 16%-50% of the microscopic study of 7585 plucked miniaturised scalp hairs from males and 3931 from females during drug efficacy trials. The data gained with the latter approach do not support the reversal theory[14]. Employing our phototrichogram, we firstly probed well-defined follicular units bearing only a single hair over long periods of time[23]. It may be important to recall that the late Dr. D. Whiting was present at this meeting, and, after invitation to comments by the chairman, he did not argue when our negative findings were first presented (EHRS meeting, Zurich, 2005).
In 2019 and 2020, we published the monitoring of 300 miniaturised hair follicles during a 2-year study on finasteride. At the end of the trial, the majority still produced a thin hair or remained empty[11-13]. We concluded that miniaturised hair follicles did not contribute significantly to the therapeutic response in line with the present study documenting 97 follicular units during a 3-month follow-up study. Collectively, the documentation now exceeds 10,000 miniaturised hair fibres without substantial proof of improvement of diameter or productivity with known drug treatments. The nature of the divergent views became clear when a threshold was put on the number of hairs counted per follicular unit of 3[35]. The prevailing dogma was that there could be no more than three follicles in a follicular unit and that any extra hair would be the result of trichostasis. As detailed in Supplement File 3, we avoided retaining the sticky hair and present some evidence that active drugs recruit a significant number of rarely cycling hair follicles, also known as dormant follicles. Minimal requirements and prediction of therapeutic potential as well as the rebound phenomenon[12] are also discussed in Supplement File 3.
As functionally inactivated follicles remain difficult or impossible to identify on scalp biopsies, as suspected by others in FPHL and/or chronic diffuse telogen hair loss[36,37], and these targets also escaped imaging methods used during efficacy studies of FDA-approved drug treatments[38], the search for potentially predicting therapeutic responses must continue. This may also open new avenues for therapeutic intervention on the microenvironment of the hair follicle. As commented by A. Messenger [Supplement File 3], this will require a substantial amount of creativity in terms of methodological approaches and drug discovery.
In Conclusion, key findings and hard evidence with clinical relevance are presented: A. Nanohair (diameter ≤ 20 µm) appears as a diagnostic criterion in most patients complaining of hair loss. B. Scalp coverage scoring reflects a continuum and avoids drawbacks of previous categorical systems. C. The HMI abacus translates scalp coverage into time to complete coverage under the provision of: a. Prior specific training and validation of observers. b. Perfect geometrical relocation of scalp sites over time for consistent SCS evaluations. c. Maintenance of a standardised hairstyle/cut during longitudinal studies. D. Evidence from monitoring of miniaturized follicles is against the prevailing theory and hypotheses based on scalp biopsy studies. Our studies supports negative conclusions: a. Rare abrupt transformation (within one cycle) of terminal hair follicles into miniaturised ones. b. Very rare abrupt - if any - reversal of hair follicle miniaturisation.
Being unable to find miniaturised hair follicles that would be rapidly turned “on” to produce terminal hair as an explanation for drug-induced regrowth, new evidence documents that miniaturised scalp hair follicles are not prone to regrow thicker hair in the long term. Regrowth can be rapidly initiated from rarely cycling or dormant terminal units.
Declarations
AcknowledgementThe present manuscript is an original publication.
Hair measurement data have been alluded to during the prestigious “O’Tar-Norwood Guest lecture”: Initiation and modulation of hair growth with medical treatment: changing the paradigms of a stochastic system in the context of scalp hair transplantation. The invited lecture was delivered before the International Society for Hair Transplantation Surgery (Prague, 2017).
Posters touched upon important historical concepts and experimental hair growth measurements presented at the 11th World Congress of Hair Research held in Sitges (Spain) under the auspices of the European Hair Research Society (2019).
Abstracts can be accessed via google search: https://www.google.com/ WCHR+2019+Abstract+Book.
*P040: Myth, belief and dogmatic thinking moves into hair science and technology during our XXI st century.
*P038: Noise from “visible hair” qualifying “hair growth stage” on a single image: stubble length depends on human intervention.
Regular discussions focussing on hair growth measurements and their clinical relevance took place inside a private “IntHairNet Club” regularly held in Brussels during a decade (2009-2019).
The longstanding correspondence by mail with H. Rushton (UK), A.G. Messenger (UK), H. Uno (USA), H. Maibach (USA) have been appreciated.
Preliminary concept HMI was shared and tested and encouraged by Luc Duteil (CPCAD, Nice, F), Hugh D. Rushton (BioScientific Ltd, UK), Gill Westgate (Gill Westgate Consultancy Ltd, UK)and Véronique Ronsse (Skinterface, Be), all appreciated.
CE-PTG-EC from its image capturing through hand processing marking of individual hair till completion of the CAIA-processing was performed by Véronique Ronsse who also helped in art work and page setup during preparation of this MS.
Manuscript has been read by Charles Cassells (Fr) and Prof. Fanny Desterbecq (Be) at critical steps on the way to formal publication. Hugh D. Rushton (BioScientific Ltd, UK) helped substantially in commenting and revising the manuscript.
My most sincere thanks for their friendly help, support and highly appreciated professional expertise.
Author’s contributionAll clinical and scientific work along with development of innovative technologies for follicular unit dot-mapping and individual hair fibre tracking was performed by the author at Skinterface (Tournai and Brussel’s site). As a single author, he wrote the manuscript.
Financial support and sponsorshipNone.
Availability of data and materialsNot applicable.
Conflict of interestAuthor declares that there are no conflicts of interest. The author might consider submitting source files to be conserved in the “Fonds van Neste” created in 2015 at the initiative of the Royal Academies for Science and the Arts of Belgium (RASAB). Concepts, designs and ideas for future applications are subject to intellectual property rights (Benelux I-DEPOT 130713).
Ethical approval and consent to participateAll methodologies and study protocols were approved by the local Ethics Committee.
Consent for publicationThe only patient seen after completing the study period 2006-2019 who volunteered for illustration puposes, gave written consent (email December 14, 2020).
Copyright© The Author(s) 2021.
REFERENCES
1. Cash TF. The psychosocial consequences of androgenetic alopecia: a review of the research literature. Br J Dermatol 1999;141:398-405.
2. Girman CJ, Rhodes T, Lilly FR, et al. Effects of self-perceived hair loss in a community sample of men. Dermatology 1998;197:223-9.
3. Kim BK, Lee S, Jun M, Chung HC, Oh SS, Lee WS. Perception of hair loss and education increases the treatment willingness in patients with androgenetic alopecica: a population-based study. Ann Dermatol 2018;30:402-8.
4. Guarrera M, Cardo P, Arrigo P, Rebora A. Reliability of hamilton-norwood classification. Int J Trichology 2009;1:120-2.
5. Dawber R, Van Neste D. Hair and Scalp Disorders. Common Presenting Signs, Differential Diagnosis and Treatment. London: Martin Dunitz; 1995. pp. 1-294.
6. Hamilton JB. Male hormone stimulation is prerequisite and an incitant in common baldness. Am J Anat 1942;71:451-80.
7. Ayob SM, Messenger AG. Androgens, hair loss and eugenics: a tale of discovery and American social history. Exp Dermatol 2015;24:412-3.
8. Ludwig E. Classification of the types of androgenetic alopecia (common baldness) occurring in the female sex. Br J Dermatol 1977;97:247-54.
9. Van Neste D. My management plan of the male patient with androgenetic alopecia. In: Van Neste D, Blume-Peytavi U, Grimalt R, Messenger A, editors. Hair Science and Technology. Tournai-Belgium: Skinterface sprl Pub.; 2003. pp. 301-10.
10. Van Neste D. Photographic techniques and quantification of hair growth. In: Humbert P, Fanian F, Maibach HI, Agache P, editors. Agache’s Measuring Skin. Springer Pub; 2017. pp. 767-86.
11. Van Neste D. Viable terminal scalp hair follicles constitute a necessary and sufficient biological end-organ that conditions clinical efficacy of finasteride in males with male pattern hair loss without implying reversal of miniaturized follicles. Skin Res Technol 2019;25:701-11.
12. Van Neste D. Maintenance of optimised hair growth from viable terminal scalp hair follicles at baseline with oral finasteride in male pattern hair loss and first evidence of a “drug dependency” and a post-finasteride “rebound effect”. Skin Res Technol 2019;25:712-9.
13. Van Neste D. Placebo-controlled dose-effect studies with topical minoxidil 2% or 5% in male-patterned hair loss treated with oral finasteride employing an analytical and exhaustive study protocol. Skin Res Technol 2020;26:542-57.
14. Hugh Rushton D, Norris MJ, Van Neste D. Hair regrowth in male and female pattern hair loss does not involve the conversion of vellus hair to terminal hair. Exp Dermatol 2016;25:482-4.
15. Van Neste D. Photographic techniques and quantification of hair growth in TRICHOLOGY: Diseases of pilosebaceous follicle. In: Camacho F, Tosti A, Randall V, editors. Grupo PV, Aula Médica SL. Édition: 3. 2017.
16. Van Neste D. Why care about linear hair growth rates (LHGR)? a study using in vivo imaging and computer assisted image analysis after manual processing (CAIAMP) in unaffected male controls and men with male pattern hair loss (MPHL). Eur J Dermatol 2014;24:568-76.
17. Rushton DH, Gilkes JJ, Van Neste DJ. No improvement in male-pattern hair loss using laser hair-comb therapy: a 6-month, half-head, assessor-blinded investigation in two men. Clin Exp Dermatol 2012;37:313-5.
18. Van Neste D, Sandraps E, Herbaut D, Lelubre P, Leroy T. Validation of scalp coverage scoring methods for scalp hair loss in male pattern hair loss (androgenetic alopecia). Skin Res Technol 2006;12:89-93.
19. Kaufman KD, Olsen E, Whiting D, et al. Finasteride in the treatment of men with androgenetic alopecia. J Am Acad Dermatol 1998;39:578-89.
20. Van Neste D. Contrast enhanced phototrichogram (CE-PTG): an improved non-invasive technique for measurement of scalp hair dynamics in androgenetic alopecia - validation study with histology after transverse sectioning of scalp biopsies. Eur J Dermatol 2001;4:326-31.
21. Leroy T, Van Neste D. Contrast enhanced phototrichogram pinpoints scalp hair changes in androgen sensitive areas of male androgenetic alopecia. Skin Res Technol 2002;8:106-11.
22. Van Neste D, Leroy T, Conil S. Exogen hair characterization in human scalp. Skin Res Technol 2007;13:436-43.
23. Van Neste D. Natural scalp hair regression in preclinical stages of male androgenetic alopecia and its reversal by finasteride. Skin Pharmacol Physiol 2006;19:168-76.
24. Reygagne P. Phototrichogram. In: Humbert P, Maibach H, Fanian F, Agache P, editors. Measuring the Skin. Cham: Springer International Publishing; 2016. pp. 1-13.
25. Kasprzak M, Sicińska J, Sinclair R. The Trichoscopy Derived Sinclair Scale: Enhancing visual assessment through quantitative trichoscopy. Australas J Dermatol 2019;60:134-6.
26. Venning V, Dawber R. Patterned androgenic alopecia in women. J Am Acad Dermatol 1988;18:1073-107.
27. Wang Q, Oh JW, Lee HL, et al. A multi-scale model for hair follicles reveals heterogeneous domains driving rapid spatiotemporal hair growth patterning. Elife 2017;6:e22772.
28. Guarrera M, Rebora A. Anagen hairs may fail to replace telogen hairs in early androgenic female alopecia. Dermatology 1996;192:28-31.
30. Hagenaars SP, Hill WD, Harris SE, et al. Genetic prediction of male pattern baldness. PLoS Genet 2017;13:e1006594.
31. Saraogi PP, Dhurat RS. Automated Digital Image Analysis (TrichoScan®) for Human Hair Growth Analysis: Ease versus Errors. Int J Trichology 2010;2:5-13.
32. Kanti V, Messenger A, Dobos G, et al. Evidence-based (S3) guideline for the treatment of androgenetic alopecia in women and in men-short version. J Eur Acad Dermatol Venereol 2018;32:11-22.
33. Leavitt M, Perez-Meza D, Rao NA, Barusco M, Kaufman KD, Ziering C. Effects of finasteride (1 mg) on hair transplant. Dermatol Surg 2005;31:1268-76. discussion 1276
34. Whiting DA, Waldstreicher J, Sanchez M, Kaufman KD. Measuring reversal of hair miniaturization in androgenetic alopecia by follicular counts in horizontal sections of serial scalp biopsies: results of finasteride 1 mg treatment of men and postmenopausal women. J Investig Dermatol Symp Proc 1999;4:282-4.
35. Whiting DA. Possible mechanisms of miniaturization during androgenetic alopecia or pattern hair loss. J Am Acad Dermatol 2001;45:S81-6.
36. Sinclair R, Jolley D, Mallari R, Magee J. The reliability of horizontally sectioned scalp biopsies in the diagnosis of chronic diffuse telogen hair loss in women. JAAD 2004;51:189-99.
37. Messenger AG, Sinclair R. Follicular miniaturization in female pattern hair loss: clinicopathological correlations. Br J Dermatol 2006;155:926-30.
Cite This Article
Export citation file: BibTeX | RIS
OAE Style
Van Neste D. Exhaustive analysis of scalp hair regression: subjective and objective perception from initial hair loss to severe miniaturisation and drug-induced regrowth. Plast Aesthet Res 2021;8:16. http://dx.doi.org/10.20517/2347-9264.2020.220
AMA Style
Van Neste D. Exhaustive analysis of scalp hair regression: subjective and objective perception from initial hair loss to severe miniaturisation and drug-induced regrowth. Plastic and Aesthetic Research. 2021; 8: 16. http://dx.doi.org/10.20517/2347-9264.2020.220
Chicago/Turabian Style
Van Neste, Dominique. 2021. "Exhaustive analysis of scalp hair regression: subjective and objective perception from initial hair loss to severe miniaturisation and drug-induced regrowth" Plastic and Aesthetic Research. 8: 16. http://dx.doi.org/10.20517/2347-9264.2020.220
ACS Style
Van Neste, D. Exhaustive analysis of scalp hair regression: subjective and objective perception from initial hair loss to severe miniaturisation and drug-induced regrowth. Plast. Aesthet. Res. 2021, 8, 16. http://dx.doi.org/10.20517/2347-9264.2020.220
About This Article
Copyright

Data & Comments
Data


 Cite This Article 25 clicks

 Like This Article 30
likes
Like This Article 30
likes


Comments
Comments must be written in English. Spam, offensive content, impersonation, and private information will not be permitted. If any comment is reported and identified as inappropriate content by OAE staff, the comment will be removed without notice. If you have any queries or need any help, please contact us at support@oaepublish.com.