
Optimization of the design of a barbed suture for flexor tendon repair using extended finite element analysis
 0
0Abstract
Aim: Use of barbed sutures for flexor tendon repair is a promising technique. These sutures lie within the substance of the tendon, avoiding the need of external knots and so improving tendon gliding. The load is dispersed equally along the length of the barbed suture, decreasing the possibility of rupture. The purpose of this article is to propose enhanced suture geometry by comparing different cross-sectional configurations, barb cut angles and cut depths using the finite element method.
Methods: Inspired by the geometry of flexor tendons, an elliptical cross-sectional wire was investigated. Mechanical behavior of five different aspect ratios (ρ = 1/3, 1/2, 1, 2, 3), three different cut angles (150°, 154°, 160°) and three cut depths (0.07-mm, 0.12-mm, 0.18-mm) were studied via extended finite element analysis using ABAQUS, for two different loading conditions: one to assess the strength of the suture and the second to evaluate the strength of a single barb. An extended finite element method has been implemented on ABAQUS to predict crack growth in viscoelastic material.
Results: Based on these results, an elliptical suture having an aspect ratio of 1/2, 160° of cut angle, and 0.12-mm of cut depth is recommended.
Conclusion: Barbed sutures are a good option for tendon repair. Our experiments assessed the mechanical performance of barbed sutures and suggested an optimized suture geometry for a single-stranded repair technique.
Keywords
Introduction
Flexor tendon injury is frequently encountered by the hand surgeon. Surgical repair of these tendons is a technical challenge, and is often accompanied by temporary immobilization of the finger to avoid tendon rupture. Different surgical techniques have been developed for flexor tendon repair using sutures[1-4] [Figure 1]. Also different suture materials have been proposed to improve the strength of the repair. An aim of a good repair is to attain good strength and healing, allow early mobilization, prevent adhesion formation, diminish the gliding resistance and to decrease rupture. Typically, the known techniques of repair such as the Bunnell, Tsuge, Kessler, modified Kessler, Strickland or any other require the use of knots. Knots themselves are prone to failure due to the increased stress concentration at the area of the knot. Other than the fact that the knot itself can let go, the knot can create pressure and so decrease the blood flow to the zone of repair. Subsequently, the risk of scar formation, adhesion and rupture increases. Barbed sutures have been proposed to overcome these drawbacks, exhibiting non-slip attributes[1,5-7].
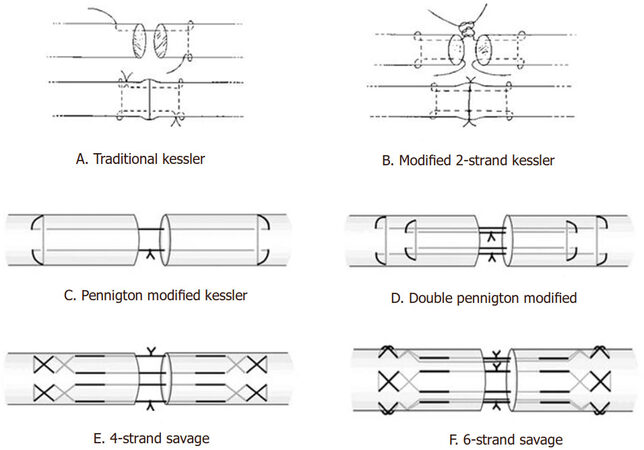
Figure 1. Different conventional knotted repair technique
In 1967 McKenzie developed a 3-0 nylon multi strand suture with protruding barbs to anchor the tendon [Figure 2A and B]; hence, eliminating the need for knots. He also demonstrated that this tenorraphy has the same tensile strength as the 2-strand Bunnell repair (17.8-26.7 N)[6-10].
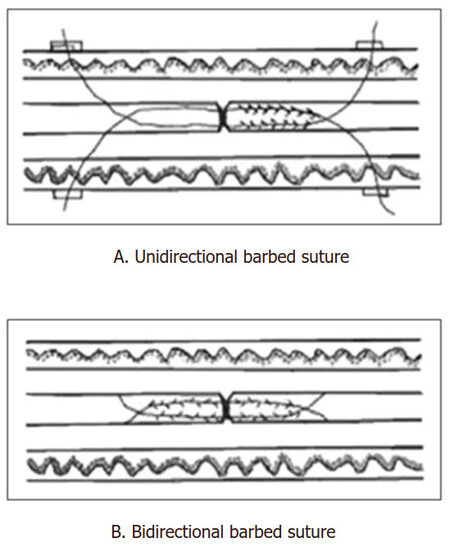
Figure 2. The two types of Mckenzie's suture with protruding barbs
This new knotless technique exhibited multiple advantages. First, the load is not concentrated on the knot but instead dispersed over an extended area of the tendon[2,11,12]. Because of the barbs, the tendon is held at multiple points which reduces the possibility of rupture[12]. Furthermore, as mentioned before, since no knots are required, risk of adhesion, rupture or tendon deformation is reduced[1,2,13].
Recently, the application of barbed sutures for tenorraphy has been of great interest. Previous research focused mainly on the mechanical properties of sutures[4,7,14-17] and tendon-barbed suture interactions in terms of tensile strength and suture-tissue pullout[4,5,12,18,19]. In this study we aim to identify the ideal suture geometry using finite element analysis as a tool. Cut angle and cut depth are the two factors that affect the the rigidity of the barb and its ability to anchor surrounding tissue. These factors will be thoroughly investigated in this study[18,20] [Figure 3]. This was also addressed in 2010 when Ingle et al.[20] performed a study on single barbed monofilaments with different cut angles and cut depths using both experimental models and finite element analysis[18,20,21].
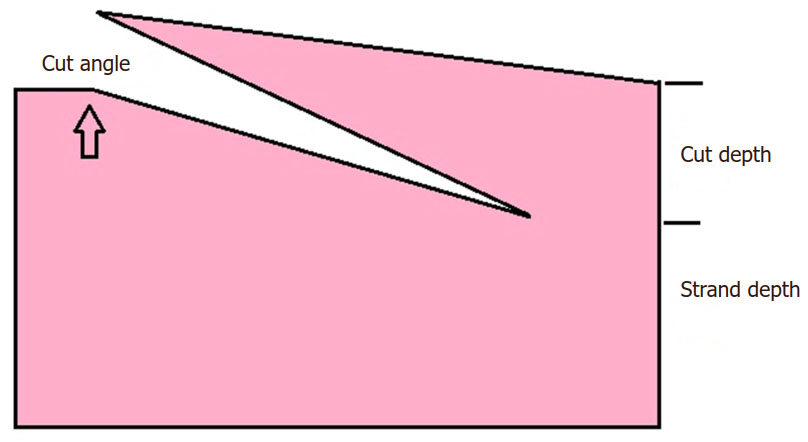
Figure 3. Cut depth and cut angle of a barbed suture
In addition to cut angle and depth, we will discuss a third geometrical factor: the cross sectional configuration of the sutures and their effect on suture strength.
Methods
The finite element analysis of the barbed suture was implemented on a commercially available package: ABAQUS 6.14. The geometric model consists of a three-dimensional deformable cylinder with an elliptical cross-sectional area to represent the suture, whereas the barb is introduced as a cell partition. Simulations were performed while varying three main factors: aspect ratio of the ellipse (ρ), cut angle and cut depth.
Initial studies relied on geometric dimensions of commercially available barbed sutures in order to gain insight regarding their performance. Existing sutures have a circular cross-sectional area[22]; that is, ρ = 1, and on average, a cut angle of 154 and a cut depth of 0.19-mm. Thus, as a starting point, a circular suture of 0.6-mm diameter, 1-mm length, 154cut angle and 0.19-mm cut depth was considered.
Cross-sectional area of the flexor tendons
The main motivation behind varying the aspect ratio of the suture arises from the elliptical nature of the flexor tendons cross-section. It is anticipated that better conformity between the suture and the tendon is achieved when both possess similar aspect ratios. Widths and heights of Flexor Digitorum Superficialis and Profundus tendons (FDS and FDP respectively) for the different fingers were obtained from the literature[23,24], in order to evaluate their aspect ratios and gain insight on possible design values for “ρ” [Table 1].
Dimensions of flexor digitorum superficialis and profondus tendons
| Index | Middle | Ring | Little | ||
|---|---|---|---|---|---|
| FDST | Major axis (a = Width/2) (mm) | 2.5 | 3.25 | 2.75 | 1.5 |
| Cross-sectional area (Area) (mm2) | 8.36 | 11.54 | 10.46 | 4.04 | |
| Minor axis (b = Height/2 = CSA/πa) (mm) | 1.064 | 1.13 | 1.21 | 0.86 | |
| Aspect ratio (ρ = a/b) | 2.35 | 2.88 | 2.27 | 1.75 | |
| FDPT | Major axis (a = Width/2) (mm) | 2.5 | 3 | 2.5 | 2.25 |
| Cross-sectional area (Area) (mm2) | 11.4 | 14.44 | 13.42 | 8.84 | |
| Minor axis (b = Height/2 = CSA/πa) (mm) | 1.452 | 1.532 | 1.708 | 1.25 | |
| Aspect ratio (ρ = a/b) | 1.722 | 1.96 | 1.46 | 1.8 |
The dimensions of the smallest tendon should be taken as the reference design such that the developed suture is suitable for use on all flexor tendons. As Table 1 shows, the FDS of the little finger has the smallest major and minor axes; a = 1.5 mm and b = 0.858 mm. On average, the aspect ratio “ρ” is 2 and varies between a maximum of 2.88 for the FDS of the middle finger and a minimum of 1.46 for the FDP of the ring finger.
Based on these findings, the values of “ρ” were varied between 1/3 and 3. The effect of the aspect ratio on the strength of the suture was investigated for constant cut angle and cut depth. Also, three different cut depths and cut angles: 0.07-mm, 0.12-mm, and 0.19-mm as depths and 150 154 and 160 as angles were studied for a constant “ρ”.
Furthermore, the radius of the suture (or the equivalent ellipse axes) was increased from 0.3 mm to a larger diameter that is suitable with both the dimensions of the smallest tendon (FDS of little finger) and the optimum aspect ratio. It is desired that the optimized suture accommodates about 30% of the tendon’s cross-sectional area. The diagram in Figure 4 clarifies the scheme that was followed.
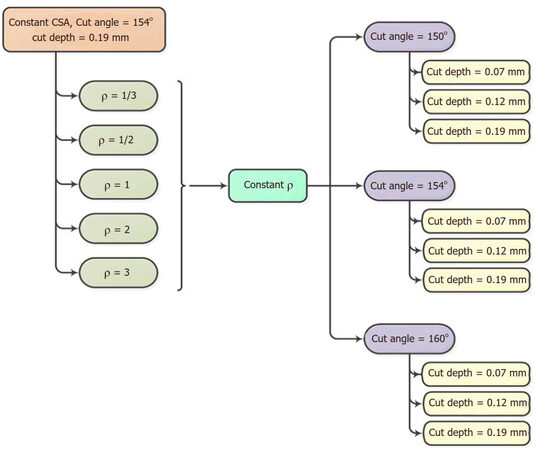
Figure 4. Flowchart clarifying the plan followed throughout the analysis
The values for diameter, cut angle, and cut depth were set for a circular cross-sectional area (CSA). When considering elliptical profiles, the major and minor axes were determined such that the area of the ellipse is equal to that of the circle. Furthermore, while the cut angles remain the same, the cut depths should be adapted for the ellipses in order to retain the same amount of intact area after inducing a cut in the sutures. The performed calculations are detailed below.
Finding major and minor axes:
(CSA)ellipse = (CSA)circle and πab = πr2
and for an ellipse,
ρ = a/b
therefore,
a = r × ρ1/2 and b = r/(ρ1/2)
To find equivalent cut depth, the remaining area of the ellipse [Figure 5] can be found using the following relation:
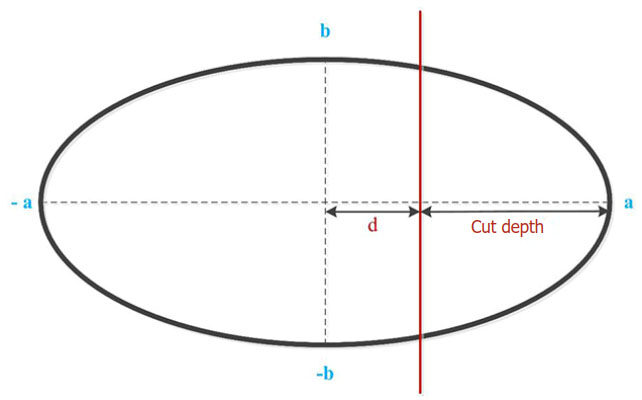
Figure 5. Diagram of an ellipse with a cut on its major axis
(RA)ellipse = a × b × [π/2 + sin-1 (d/a)] + [b × d × (a2 - d2)1/2]/a (Equation 1)
Where “a” and “b” are the major and minor axes respectively, and “d” is the distance from the centre of the cut (d = a - cut depth).
Since the remaining area of the ellipse should be equal to that of the circle, Equation (1) was used with a = b = r (radius of the circle) along with the desired cut distance “d” in order to determine the remaining area of the circle. Once the later was known, it was set as the remaining area of the ellipse and the equation was solved for the equivalent “d”. The corresponding cut depth is simply found by subtracting the major axis from the cut distance; that is, cut depth = a - d [Table 2].
Ellipse equivalent dimensions and cut depth
| Ellipse equivalence | |||||
|---|---|---|---|---|---|
| Aspect ratio (ρ = a/b) | 1/3 | 1/2 | 1 | 2 | 3 |
| Major axis a (mm) | 0.1732 | 0.2121 | 0.3 | 0.4243 | 0.5196 |
| Minor axis b (mm) | 0.5196 | 0.4243 | 0.3 | 0.2121 | 0.1732 |
| Cross-sectional area (Area) (mm2) | 0.2827 | 0.2827 | 0.2827 | 0.2827 | 0.2827 |
| Remaining area (RA) (mm2) | 0.2059 | 0.2059 | 0.2059 | 0.2059 | 0.2059 |
| Cut distance d (mm) | 0.0635 | 0.0778 | 0.11 | 0.1556 | 0.1905 |
| Cut depth (mm) | 0.1097 | 0.1344 | 0.19 | 0.2687 | 0.3291 |
For simplification purposes, a single barb was included in the model with five different geometries used for this experimental analysis [Figure 6].
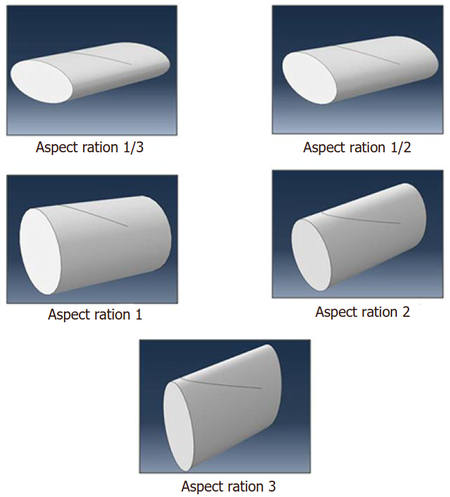
Figure 6. Different geometries used in modeling
Material modeling
The material properties of polypropylene which correspond to the material usually used for flexor tendon repair were obtained after performing tensile tests to failure on 12 different suture specimens. This allowed us to determine polypropylene’s short-term linear elastic behavior, which requires the definition of an instantaneous Young’s Modulus and a Poisson’s ratio [Table 3].
Elastic properties of propylene
| Mean | Standard Deviation | |
|---|---|---|
| Young’s Modulus (MPa) | 1668.67 | 573.37 |
| Poisson’s ratio | 0.36878 | 0.06347 |
| Tensile strength (MPa) | 353.15 | 48.81 |
The time-dependent behavior, on the other hand, was specified as previously described, via inputting into ABAQUS normalized shear relaxation data with respect to the initial stress along with the respective time instants as obtained from the relaxation tests. ABAQUS then performs a curve fitting analysis to determine the prony series coefficients. Computed values for the normalized shear gi and bulk ki moduli, in addition to the corresponding relaxation times ti [Table 4] and a plot of the normalized stress relaxation behavior and its curve were calculated [Figure 7].
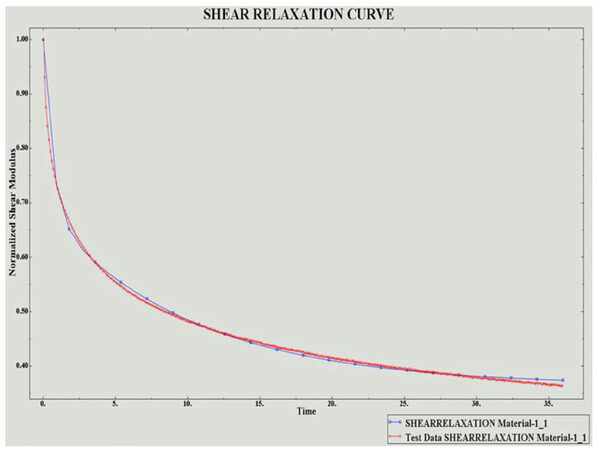
Figure 7. Shear relaxation curve from experimental data (red) and ABAQUS curve fitting (blue)
Prony series coefficients for polypropylene obtained from ABAQUS
| I | gi | ki | ti |
|---|---|---|---|
| 1 | 0.31542 | 0 | 0.63594 |
| 2 | 0.32027 | 0 | 10.243 |
It is noteworthy to point out that the relaxation times gotten from experimentation were scaled by 100 when inputted into ABAQUS such that the total time becomes 36 s instead of 3600 s (60 min). This was done in order to avoid lengthy simulations and to be able to capture polypropylene’s relaxation behavior within the model.
As for damage initiation, the maximum principal stress was chosen[24-28]. Since this criterion defines the nucleation of a defect within the body, and since the geometric model at hand has a crack already defined, the value for Maxps is not of high significance for this crack propagation analysis. The calculated true ultimate strength was used as the limiting maximum principal stress. The conversion of the engineering tensile strength obtained from tensile experiments to its true equivalent was done using the following relation: σtrue = σeng (1 + σeng).
Applied to polypropylene [Table 3]: σtrue = 353.147 (1 + 0.39145) = 491.39 MPa, the value of Maxps was set at 491.39 MPa specified at the crack tip. For a mesh that is not sufficiently refined in the vicinity of the crack tip, the default centroidal approximation of the Maxps may not be accurate. It is recommended that the stresses be extrapolated to the crack tip[29-36]. As for tolerance, the default value of 0.05 was kept.
For a pre-existing crack, damage evolution is much more important for the analysis. Based on the principles of LEFM, a power law mixed mode energy-based criterion was selected with the power set as 1. The critical Mode I, Mode II, and Mode III energy release rates (GIc, GIIc, and GIIIc respectively) should be specified. These values were obtained as critical stress intensity factors KIc and KIIc form the literature[37] and converted to values for GIc and GIIc assuming plane strain conditions using the following equations:
GIc = [KIC2 (1 - v2)]/E and GIIc = [KIIC2 (1 - v2)]/E
Where E is the Young’s Modulus and v is the Poisson’s ratio.
For KIc = 5.5 MPa (m)1/2 , and KIIc = o.44 KIc = 2.42 MPa (m)1/2:
GIc = [KIC2 (1- v2)]/E = [(5.5)2 (1 - 0.368782)]/1668.67 = 15.663 MPa.mm
and
GIIc = [KIIC2 (1- v2)]/E= [(2.42)2 (1 - 0.368782)]/1668.67 = 3.0323 MPa.mm
Or alternatively,
GIIC = (0.44)2 GIC = 3.0323 MPa.mm
For Mode III, it was assumed that the critical energy release rate GIIIc was equal to that of mode II due to the lack of fracture toughness data for this out-of-plane shear. As such, GIc, GIIc, and GIIIc were set to be equal to 15.663 MPa.mm, 3.0323 MPa.mm, and 3.0323 MPa.mm respectively.
For damage stabilization, viscous regularization was used to specify viscosity coefficients[25-30]. When the model exhibits material softening and stiffness degradation, severe convergence problems arise. A viscous regularization scheme helps improve convergence by stabilizing the model during damage. The value for the viscosity coefficient should be chosen such that stabilization does not significantly influence the final results. To make sure that this is the case, the viscous dissipation output (ALLVD) should be small compared to the strain energy (ALLSE). Throughout this analysis, viscous regularization was chosen to be 1E-005. ALLVD and ALLSE for a circular suture having a cut angle 154 and cut depth 0.19-mm are shown in Figure 8. ALLVD is nearly zero and is very small compared to ALLSE. Similarly, the selected value was checked for all other models to ensure that it did not affect the solution.
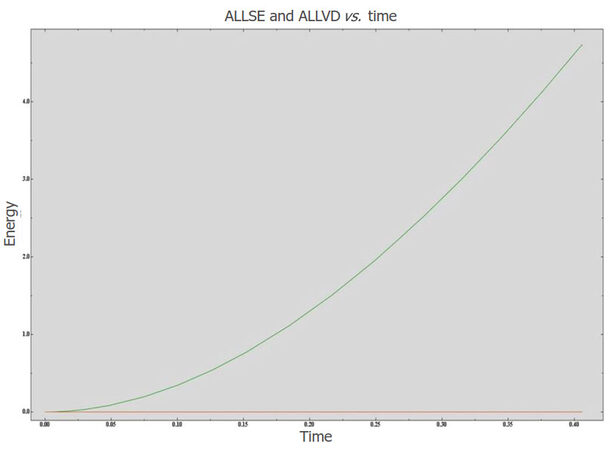
Figure 8. ALLSE and ALLVD for the whole model with respect to time
Crack modeling
For the definition of the crack in ABAQUS[27-33], the suture geometry was selected as the domain while the barb created as a cell partition was specified as the crack [Figure 9]. An XFEM crack growth interaction was created and crack propagation was allowed in the initial step.
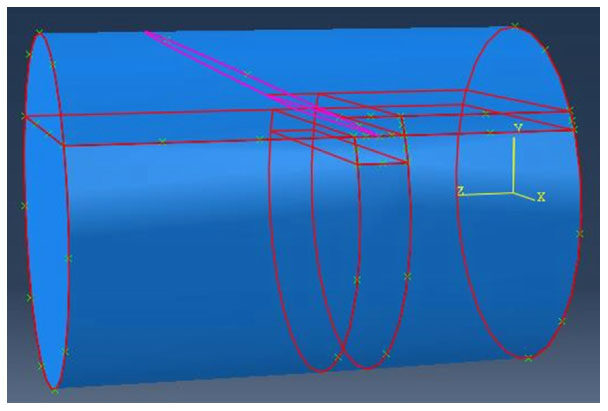
Figure 9. Defining the crack using XFEM
As aforementioned, XFEM based on VCCT was implemented as the fracture criterion to model crack propagation. A contact interaction property was created with energy-based mixed mode power law. Maximum tangential shear stress was chosen to be the direction of crack growth. A tolerance of 0.05 and viscosity of 1E-005 were specified. Tolerance for unstable crack propagation was toggled on and kept at its default value of 0.2.
Mode I, Mode II, and Mode III critical energy release rates were given the same values as those previously specified for the damage evolution criterion. As for the powers am, an and ao [Table 5], they were found in the literature to be 1, 2, and 1 respectively[27].
Input for mixed-mode power law
| Mode I | Mode II | Mode III | am | an | ao |
|---|---|---|---|---|---|
| 15.663 | 3.0323 | 3.0323 | 1 | 2 | 1 |
In order to visualize a crack when using XFEM analysis, PHILSM and PSILSM should be requested as output. PSILSM is required to view the initial crack front, while PHILSM is necessary to observe the location of the crack. Also, the output STATUSXFEM should be chosen in order to perceive the status of the enriched elements. A value of 0 for this output means that the element is undamaged, a value of 1 means that the element has been completely cut by the crack, and a value between 1 and 0 signifies that the element is damaged but some traction forces remain.
Boundary conditions and loads
The performance of the barbed suture was investigated under two loading conditions. The first case studies the strength of the suture and simulates a tensile test whereby one end is held fixed while the other is subjected to a finite displacement. The second case investigates the strength of a single barb. The boundary conditions are similar to those of the first load case, but in this analysis, the surface of the barb is constrained in the direction of application of the displacement[34-37].
Three loading situations were performed. In loading case 1, the right extremity was fixed by an ENCASTRE boundary condition applied in the initial step and propagated to the following Static and Visco steps. As for the left edge, a displacement/rotation boundary condition was specified at the surface. The displacement in z-direction, U3 was set to 0 initially. However, it was modified in the first Static step to a ramped displacement of magnitude 0.5-mm and was propagated to the subsequent Visco step [Figure 10].
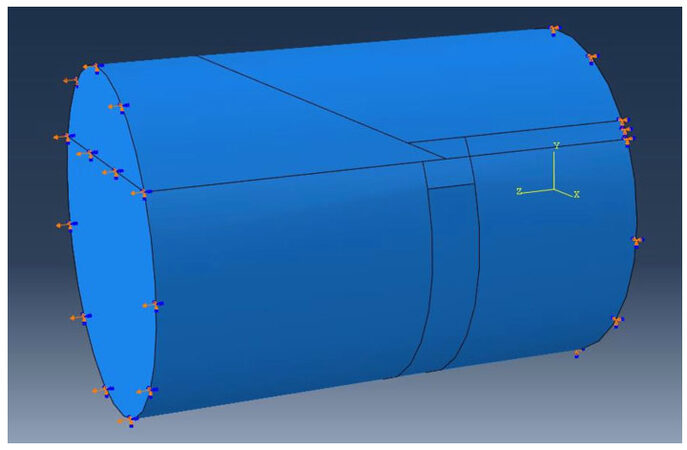
Figure 10. Boundary conditions for load case 1
Average stresses and strains in the body of the suture below the crack tip were of interest at the onset of failure. For this reason, an element set, Elem1, was created and associated with a Field Output Request to report strains and stresses in the z-direction, NE33 and S33 respectively [Figure 11].
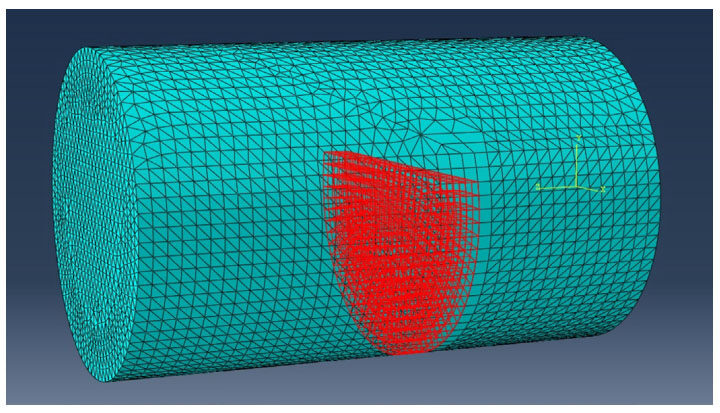
Figure 11. The position of Elem1 set highlighted in red
In loading case 2, the left extremity was fixed by an ENCASTRE boundary condition applied in the initial step and propagated to the following Static and Visco steps. As for the right edge, a displacement/rotation boundary condition was specified at the surface. The displacements in x, y, and z-directions, U1, U2, and U3 respectively as well as the rotations in these directions, UR1, UR2, and UR3 respectively were set to 0 initially. However, U3 was modified in the first Static step to a ramped displacement of magnitude 0.3-mm and was propagated to the subsequent Visco step. Furthermore, a third boundary condition was applied at the crack which was constrained in the direction of application of the displacement; roller in z-direction. Since the created partition to represent the barb was defined as a crack, loads and boundary conditions could not be defined exactly at the surface. For this reason, a new partition was created by offsetting the plane of the crack by 0.005-mm. The roller boundary condition was applied at that surface [Figure 12].
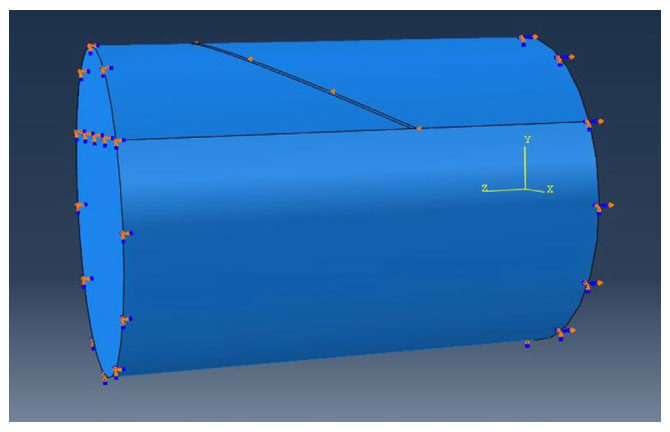
Figure 12. Boundary conditions for load case 2
Since the main concern from applying this test case is to investigate the strength of a single barb, average stresses at the surface of the crack were monitored at the onset of failure. For this reason, an element set, BabrElem, was created and associated with a Field Output Request to report Von-mises stresses [Figure 13].
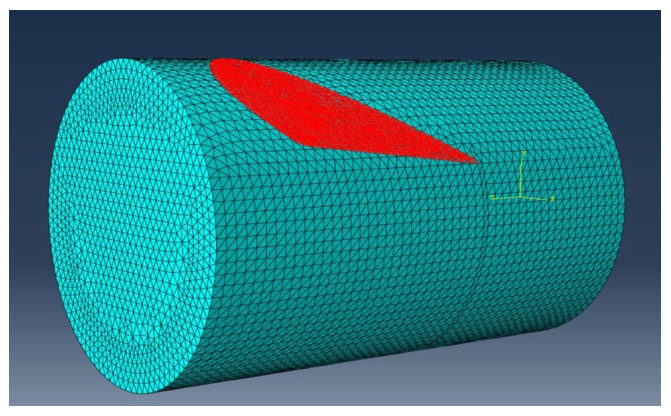
Figure 13. The position of BarbElem set highlighted in red
Finally, loading case 3 was set in order to investigate the behavior of the suture when loads are applied to both, the body of the suture and the surface of the barb, so a third test case which combines the former test conditions was applied. The significance of this study lies in its resemblance to the real-life suture-tendon interaction. These loading conditions were considered for the final optimized geometry only.
After assessing the forces exerted in the different repaired FDS & FDP tendons during the five different protocols of rehabilitation [Table 6], the highest median forces were noted during FDP maneuver and can reach a mean peak of 25 N[38,39].
Peak forces recorded in FDP and FDS tendons during five rehabilitation exercises for two different wrist positions
| Forces recorded | Place and hold | Active finger flexion | Isolated FDP flexion | Isolated FDS flexion | Tenodesis | ||||
|---|---|---|---|---|---|---|---|---|---|
| Wrist neutral | Wrist flexed | Wrist neutral | Wrist flexed | Wrist neutral | Wrist flexed | Wrist neutral | Wrist flexed | ||
| Peak FDP forces (N) | |||||||||
| Mean | 3.6 | 3.1 | 6.5 | 5.9 | 25.5 | 23.8 | 3.1 | 2.9 | 2.8 |
| SD | 3.1 | 2.8 | 5.1 | 4.7 | 20.4 | 19.6 | 5.2 | 7.5 | 4.8 |
| Maximum | 10.6 | 10.1 | 17.3 | 17.8 | 73.8 | 74.7 | 16.0 | 22.7 | 15.8 |
| Peak FDS forces (N) | |||||||||
| Mean | 4.9 | 7.7 | 2.9 | 3.5 | 4.3 | 4.2 | 12.9 | 14.1 | 2.7 |
| SD | 2.6 | 5.6 | 6.7 | 12.9 | 3.1 | 5.1 | 6.4 | 8.0 | 1.0 |
| Maximum | 10.9 | 23.7 | 25.6 | 47.5 | 12.9 | 20.0 | 24.2 | 32.9 | 4.6 |
A first factor of safety of 18% was added in order to withstand the tendon softening and the decrease in the repair strength during the early days after tendon repair and a second factor of safety of 30% was considered to compensate the risk of gap formation in the zone of repair. So the force of 25 N becomes 37 N and this was comforted by the literature which advices an ultimate repair strength of at least 30 to 55 N with a mean force of 40 N when an active rehabilitation maneuvers are involved[40].
So in loading case 3, the left extremity was subjected to a displacement/rotation boundary condition. The displacements in x, y, and z-directions, U1, U2, and U3 respectively as well as the rotations in these directions, UR1, UR2, and UR3 respectively were set to 0 initially. However, U3 was modified in the first Static step to a ramped displacement of magnitude 0.096-mm equivalent to 40N, as obtained from the load-displacement curve generated for the model on ABAQUS [Figure 14]. The right extremity was fixed by an ENCASTRE boundary condition applied in the initial step and propagated to the following Static and Visco steps. Furthermore, a third boundary condition was applied at the crack. A ramped displacement of magnitude 0.05-mm was defined perpendicular to the offset surface that was partitioned in the second test case [Figure 15]. This boundary condition was created in the Visco step such that the body of the suture has been preloaded with a value of 40 N.
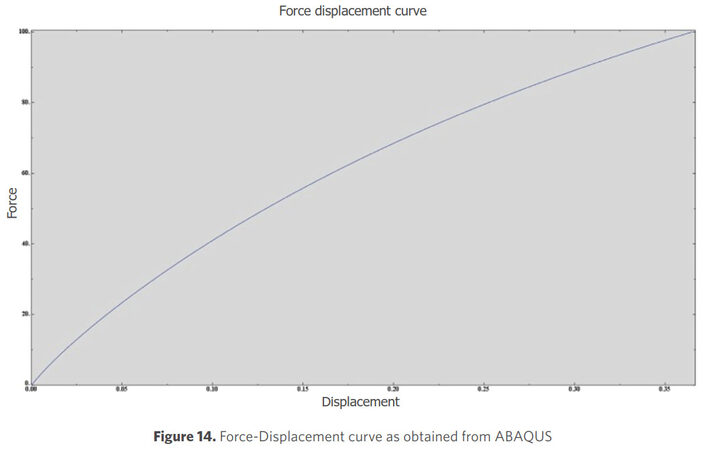
Figure 14. Force-Displacement curve as obtained from ABAQUS
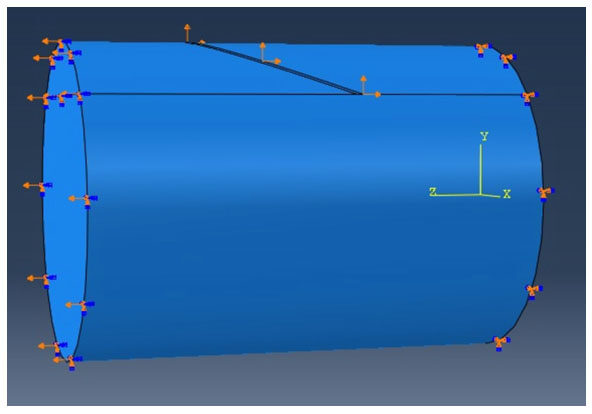
Figure 15. Boundary conditions for load case 3
Meshing
The impact of the quality of the mesh on the correctness of the generated solution can never be overemphasized. A high-quality mesh is one that serves the objective of the model; obtain a solution with the needed accuracy by using only as many degrees of freedom as necessary.
The mesh is refined until a critical result, such as the maximum stress in a specific location, converges; that is, it does not change significantly with further refinement (h-method).
A mesh convergence analysis was performed for this study for the two loading cases. The investigation was carried out for the circular suture (ρ = 1) having a cut angle of 154, and a cut depth 0.19-mm.
In loading case 1, meshing was done using linear tetrahedral elements (C3D4). A mesh sensitivity analysis was carried to determine the optimum mesh size among the tested values: 0.015, 0.02, 0.025, 0.027, 0.03, 0.031, 0.035 and 0.037. The corresponding average strains at onset of failure for the set Elem1 for each mesh size are summarized in Table 7.
Average strains at failure (%) detected for different mesh sizes of linear tetrahedral elements
| Mesh convergence C3D4 | ||
|---|---|---|
| Mesh size | Number of elements | Failure strain (%) |
| 0.015 | 376,896 | 19.2 |
| 0.02 | 181,649 | 17.76 |
| 0.025 | 98,739 | 16.7 |
| 0.027 | 85,062 | 24 |
| 0.03 | 60,375 | 24.2 |
| 0.031 | 53,559 | 18.74 |
| 0.035 | 40,507 | 16.8 |
| 0.037 | 35,679 | 16.82 |
No significant trend was observed and convergence was obviously not attained. An error of 31% between the maximum and minimum values of the strain was noted. To resolve this problem, a local structured mesh of brick elements with reduced integration (C3D8R) was generated in the critical region near the crack tip while the global mesh type was kept as tetrahedral elements C3D4 [Figure 16].
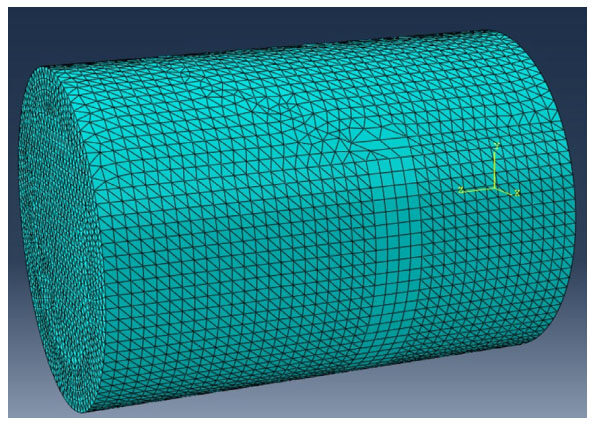
Figure 16. Mesh for load case 1 consisting of structured brick elements near the crack
Again, a mesh sensitivity analysis was performed for the mesh sizes: 0.015, 0.022, 0.024, 0.025, 0.027, 0.03, 0.035, 0.04 and 0.05. For each mesh size, the corresponding average strain at onset of failure was recorded with the results summarized in Table 8.
Average strains at failure (%) detected for different mesh sizes of mixed brick and tetrahedral elements
| Mesh convergence C3D8R | ||
|---|---|---|
| Mesh size | Number of elements | Failure strain (%) |
| 0.015 | 469,222 | 19.45 |
| 0.022 | 174,020 | 18.65 |
| 0.024 | 134,521 | 17.8 |
| 0.025 | 124,261 | 18 |
| 0.027 | 98,441 | 18 |
| 0.03 | 80,790 | 19.12 |
| 0.035 | 46,826 | 20.3 |
| 0.04 | 32,946 | 19.5 |
| 0.05 | 16,527 | 18.8 |
Finally, a converged mesh has been obtained with a maximum error of 12% between the maximum and minimum values of the strain. A mesh size of 0.025 (124,261 elements) was chosen, taking into consideration both accuracy of the results and the required simulation time.
In loading case 2, in order to avoid the difficulties faced in loading case 1 particularly the possibility of nodes connections forming new elements instead of being deleted at the crack site, linear tetrahedral elements (C3D4) were used to mesh the whole model. For the mesh sizing, a mesh convergence study was carried out considering the following sizes; 0.02, 0.025, 0.03 and 0.035.
For each mesh size, the corresponding average maximum principal stress at the surface of the barb when a crack started to propagate (BarbElem) was recorded [Table 9].
Average maximum principal stress (MPa) at failure detected for different mesh sizes of linear tetrahedral elements
| Mesh convergence C3D4 | ||
|---|---|---|
| Mesh size | Number of elements | Maximum principal stress (MPa) |
| 0.02 | 183,967 | 32.5 |
| 0.025 | 108,708 | 29.9 |
| 0.03 | 66,309 | 31.59 |
| 0.035 | 41,139 | 32.5 |
A converged mesh has been attained with a maximum error of 8% between the maximum and minimum values of the maximum principal stress and a mesh size of 0.025 (108,708 elements) was chosen for the same reasons as in loading case 1 [Figure 17].
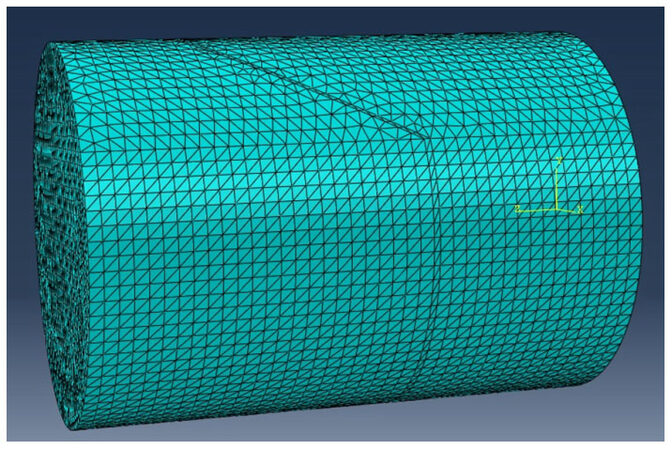
Figure 17. Mesh for load case 3 consisting of linear tetrahedral elements
Results
The results of the finite element of the models detailed above subjected to load cases 1 and 2 are reported. The attained optimized suture geometry is then tested under the loading case 3.
Results with variant aspect ratio, constant cut angle & constant cut depth
At first, the aspect ratios were varied for a constant cross-sectional area equivalent to that of a circle having a radius of 0.3-mm, a constant cut angle (CA) of 154 and cut depth (CD) of 0.19-mm for both loading conditions. The second step was to investigate the effect of varying CA and CD for a constant.
With constant cut angle and cut depth, in the loading case 1, an ENCASTRE and a displacement/rotation boundary conditions were applied to the suture geometry as thoroughly described in the boundary conditions and loads section. Stresses and strains in the z-direction, S33 and NE33 respectively, in the body of the suture (Elem1) were reported at the onset of crack propagation and compared among the different cross-sections [Table 10].
Average stresses (MPa) and strains (%) at failure for load case 1, constant CSA, CA = 154°, CD = 0.19 mm
| Results for load case 1 | ||
|---|---|---|
| Elem 1 | ||
| Aspect ratio (ρ) | NE33 (%) | S33 (MPa) |
| 1/3 | 19.23 | 280 |
| 1/2 | 18.65 | 275.92 |
| 1 | 17.98 | 262 |
| 2 | 18.05 | 264 |
| 3 | 18.1 | 265 |
So, changing the aspect ratio can affect the strength of the suture. The highest strains and stresses are observed for aspect ratio 1/3. As such, ρ = 1/3 is the strongest, followed by 1/2, 3, 2, and finally 1. A circular suture is found to be the weakest among all configurations. However, since the differences in the magnitudes of NE33 and S33 are not significant, the results cannot be considered conclusive. No clear trend is detected.
In this circular cross-sectional model, the direction of propagation of the crack is almost perpendicular to the applied displacement and the rupture failure is spotted. Similar behaviors are observed for all other aspect ratios [Figures 18 and 19].
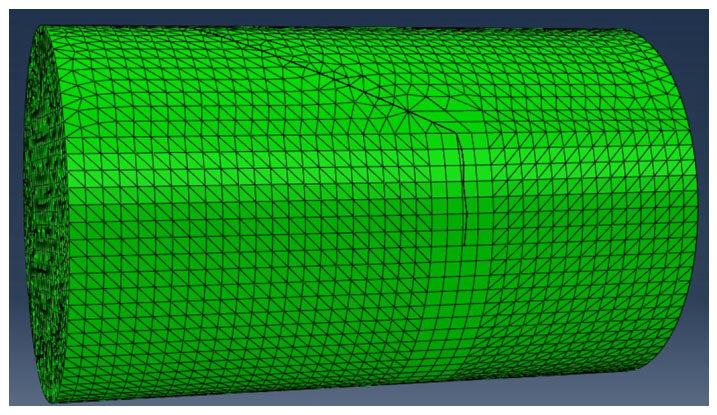
Figure 18. Initial situation of the suture under load case 1
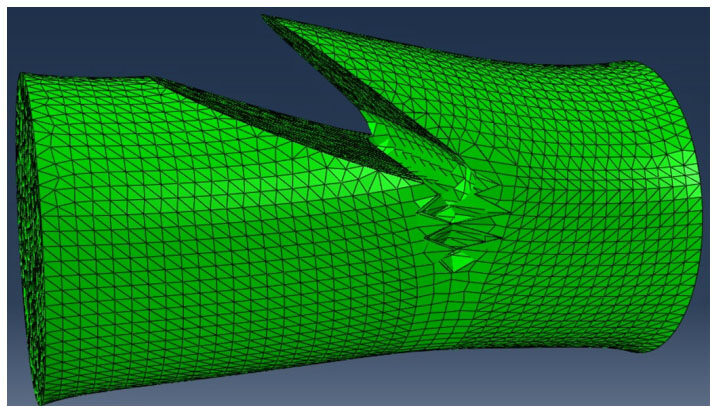
Figure 19. A propagating crack in a circular suture subjected to load case 1
In loading case 2, the results reveal an evident trend [Table 11]. As the aspect ratio decreases below 1, the barb strength increases. The opposite is noticed for increasing the aspect ratio beyond 1. Therefore, the strongest geometry belongs to ρ = 1/3, followed by 1/2, 1, 2, and finally 3. Notice that the area of the barb remains constant despite the variations in both major and minor axes of the ellipses. This is anticipated since the criterion for determining the dimensions of the ellipses was to have the same remaining area, or alternatively, equal areas removed.
Average stresses (MPa) and their corresponding forces at failure for load case , constant CSA, CA = 154°, CD = 0.19 mm
| Results for load case 2 | |||||
|---|---|---|---|---|---|
| Barb area (mm2) | BarbElem | ||||
| Aspect ratio (ρ) | a (mm) | b (mm) | Area (mm2) | Von-mises (MPa) | Force (N) |
| 1/3 | 0.48343 | 0.250245 | 0.19 | 49 | 9.31 |
| 1/2 | 0.39474 | 0.306407 | 0.19 | 45.09 | 8.57 |
| 1 | 0.27911 | 0.433423 | 0.19 | 39.25 | 7.46 |
| 2 | 0.19732 | 0.612951 | 0.19 | 36 | 6.84 |
| 3 | 0.16115 | 0.750711 | 0.19 | 34.5 | 6.56 |
The direction of crack propagation for a circular cross-section model is being almost parallel to the applied displacement. Under such boundary conditions, peeling rather than rupture failure is detected. All other aspect ratios behave in a similar manner [Figure 20].
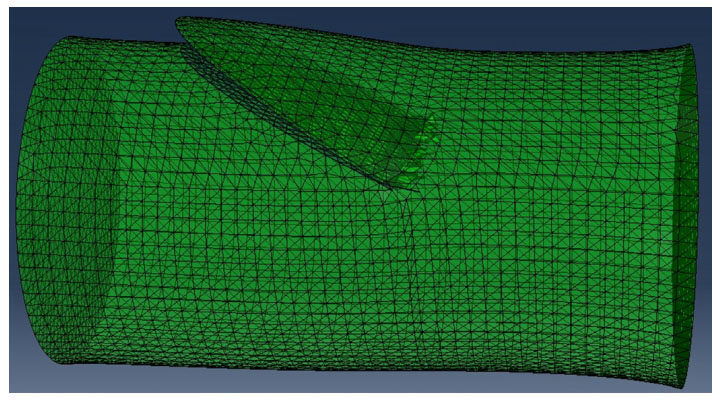
Figure 20. A propagating crack in a circular suture subjected to load case 2
The results obtained for constant cross-sectional area, constant cut angle and cut depth for both loading cases 1 & 2, cannot offer a decisive conclusion regarding the best cross-sectional configuration. A mere 7% increase in %NE33 is observed when comparing the weakest suture (ρ = 1) with the strongest one (ρ = 1/3). Also, it is not clear which condition leads to an increased suture strength, decreasing the aspect ratio below one or increasing it. On the other hand, a 30% rise in the barb force is detected for LC2 when changing the aspect ratio from 3 to 1/3.
So since the aspect ratio ρ of the tendon is 2, a suture with an aspect ratio of 1/2, given the findings up till this point, appears to be most suitable. Furthermore, since the smallest major and minor axes among the tendons are a = 1.5-mm and b = 0.858-mm respectively, the radius (or the equivalent ellipse axes) of the suture can be increased from 0.3 mm to a larger diameter that is suitable with both the dimensions of the smallest tendon and the optimum aspect ratio. It is desired that the optimized suture accommodates about 30% of the tendon’s cross-sectional area. Consequently, a suggested geometry has the following characteristics: ρ = 1/2, a = 0.25-mm and b = 0.5-mm.
Results with constant aspect ratio, variant cut angle & variant cut depth
The results of a constant suture aspect ratio , with different cut angles and cut depths are reported below. A circular cross-section was used with a radius of 0.3536-mm equivalent to an ellipse having a = 0.25-mm and b = 0.5-mm. While the cut angles remain the same, the cut depths were adapted for the ellipse [Table 12].
Equivalent dimensions and cut depths for ρ = 1/2
| Ellipse equivalence | |||
|---|---|---|---|
| Aspect ratio | |||
| 1/2 | 1 | ||
| Major axis a (mm) | 0.25 | 0.3536 | |
| Minor axis b (mm) | 0.5 | 0.3536 | |
| Cross-sectional Area (CSA) (mm2) | 0.3928 | 0.3928 | |
| CD = 0.07 mm | Remaining Area (RA) (mm2) | 0.3726 | 0.3726 |
| Cut distance d (mm) | 0.2005 | 0.2836 | |
| Cut depth (mm) | 0.0495 | 0.07 | |
| CD = 0.12 mm | Remaining Area (RA) (mm2) | 0.3485 | 0.3485 |
| Cut distance d (mm) | 0.16515 | 0.2336 | |
| Cut depth (mm) | 0.0849 | 0.12 | |
| CD = 0.19 mm | Remaining Area (RA) (mm2) | 0.3078 | 0.3078 |
| Cut distance d (mm) | 0.11565 | 0.1636 | |
| Cut depth (mm) | 0.1344 | 0.19 | |
In loading case 1, the boundary conditions were applied to a cylinder with a circular cross-section of r = 0.3536-mm for the cut angles 150, 154, and 160, and cut depths 0.07-mm, 0.12-mm and 0.19-mm. The outputs of interest are the same as before for the same load case [Table 13].
Average stresses (MPa) and strains (%) at failure for load case 1, ρ = 1 for varying cut angles and cut depths
| Results for load case 1, ρ = 1, r = 0.3536 mm | |||
|---|---|---|---|
| Elem 1 | |||
| Cut angle (o) | Cut depth (mm) | NE33 (%) | S33 (MPa) |
| 160 | 0.19 | 21.55 | 306 |
| 0.12 | 24 | 325 | |
| 0.07 | 29.63 | 384 | |
| 154 | 0.19 | 18.1 | 264 |
| 0.12 | 21.18 | 297 | |
| 0.07 | 26.25 | 350 | |
| 150 | 0.19 | 17 | 250 |
| 0.12 | 20.05 | 285 | |
| 0.07 | 25.06 | 336 | |
For a constant cut angle, decreasing the cut depth leads to stronger sutures that fracture at higher average strains. This result is expected since a smaller cut depth is synonymous with a smaller crack. On the other hand, for a constant cut depth, increasing the cut angle results in stronger geometries. From this analysis, the best configuration is CA = 160 and CD = 0.07-mm.
In loading case 2, the analysis was performed for a circular suture of r = 0.3536-mm for the cut angles and cut depths 150, 154, and 160, and 0.07-mm, 0.12-mm and 0.19-mm respectively. The outputs of interest are the same as before for the same load case [Table 14].
Average stresses (MPa) and their corresponding forces at failure for load case 2, ρ = 1 for varying cut angles and cut depths
| Results for load Case 2, ρ = 1, r = 0.3536 mm | ||||||
|---|---|---|---|---|---|---|
| Barb area (mm2) | BarbElem | |||||
| Cut angle (o) | Cut depth (mm) | a (mm) | b (mm) | Area (mm2) | Von-mises (MPa) | Force(N) |
| 160 | 0.19 | 0.313477 | 0.555523 | 0.2735 | 37.76 | 10.33 |
| 0.12 | 0.265451 | 0.350857 | 0.1463 | 47.39 | 6.93 | |
| 0.07 | 0.211197 | 0.204666 | 0.0679 | 54.9 | 3.73 | |
| 154 | 0.19 | 0.313477 | 0.433423 | 0.2134 | 39.08 | 8.34 |
| 0.12 | 0.265451 | 0.273741 | 0.11414 | 41.22 | 4.7 | |
| 0.07 | 0.211197 | 0.159682 | 0.053 | 56.9 | 3.02 | |
| 150 | 0.19 | 0.313477 | 0.38 | 0.18712 | 36.035 | 6.74 |
| 0.12 | 0.265451 | 0.24 | 0.1 | 43.68 | 4.368 | |
| 0.07 | 0.211197 | 0.14 | 0.0464 | 58.42 | 2.71 | |
For a constant cut angle, decreasing the cut depth results in a weaker barb that can withstand lower forces. On the other hand, for a constant cut depth, increasing the cut angle results in stronger barbs. This is expected, for when both CA and CD increase, the barb area increases as well, allowing it to endure higher forces. From this analysis, the best configuration is CA = 160 and CD = 0.19-mm
Optimized geometry
With respect to aspect ratios, it was concluded that ρ = 1/3 presents the strongest design as compared to other aspect ratios. Taking into consideration the tendon’s cross-section, it was decided that ρ = 1/2 is most suitable.
Concerning cut angles and cut depths, it was found from the load case 1, that the best configuration corresponds to CA = 160 and CD = 0.07-mm. For the second test case, CA = 160 and CD = 0.19-mm were found to offer the best results. As such, a cut angle of 160 is evidently superior. However, a decision on the cut angle is not direct. A middle value between 0.19-mm and 0.07-mm was chosen; that is, 0.12-mm.
Therefore, the optimum geometry has an aspect ratio ρ = 1/2, CA = 160 and CD = 0.12-mm. Load cases 1 and 2 were performed again for this optimized geometry [Table 15].
Results for the optimized geometry for load cases 1 and 2
| Results for ρ = 1/2, CA = 160, CD = 0.12 mm | |||
|---|---|---|---|
| Loading case 1 | Loading case 2 | ||
| Elem 1 | BarbElem | ||
| NE33 (%) | S33 (MPa) | Von-mises (MPa) | Force (N) |
| 26.88 | 362 | 52.69 | 7.71 |
Comparing the results with those obtained for a circular cross-section [Table 16] for the same cut angle and cut depth confirms the conclusion that aspect ratio 1/2 is superior. The average strains as well as the forces at the surface of the barb at onset of crack propagation increase by 12%, and 11% respectively.
Results for ρ = 1, CA = 160°, CD = 0.12 mm subjected to both load cases 1 and 2
| Results for ρ = 1, CA = 160, CD = 0.12 mm | |||
|---|---|---|---|
| Loading case 1 | Loading case 2 | ||
| Elem 1 | BarbElem | ||
| NE33 (%) | S33 (MPa) | Von-mises (MPa) | Force (N) |
| 24 | 325 | 47.39 | 6.93 |
Since the values for both cut angle and cut depth were varied for a circular cross-section, the observed trend was to be validated for ρ = 1/2. The test was performed once for a constant CA of 160 and two different values for CD: 0.19-mm and 0.12-mm, and another time for a constant CD of 0.19-mm while changing the CA from 160 to 154.
For a constant cut depth, decreasing the cut angle resulted in a weaker suture and a barb that can tolerate lower forces (decrease of 14% in %NE33 and 33% in the force), as observed for ρ = 1 [Table 17]. For a constant cut angle, decreasing the cut depth resulted in a stronger suture (24% higher %NE33) but a weaker barb (120% lower barb forces). This was also noted for a circular cross-section.
Summary of results for ρ =1 and ρ =1/2, for varying cut angles and cut depths under both load cases
| Loading case 1 | Loading case 2 | ||||
|---|---|---|---|---|---|
| Results for ρ = 1/2, a = 0.25 mm, b = 0.5 mm | |||||
| Elem 1 | BarbElem | ||||
| Cut angle (o) | Cut depth (mm) | NE33 (%) | S33 (MPa) | Von-mises (MPa) | Force (N) |
| 160 | 0.19 | 21.71 | 311 | 61. 9 | 16.93 |
| 0.12 | 26.88 | 362 | 52.69 | 7.71 | |
| 154 | 0.19 | 18.7 | 275 | 52.8 | 11.27 |
| Results for ρ = 1, a = 0.3536 mm | |||||
| 160 | 0.19 | 21.55 | 306 | 37.76 | 10.33 |
| 0.12 | 24 | 325 | 47.39 | 6.93 | |
| 154 | 0.19 | 18.1 | 264 | 39.08 | 8.34 |
A loading case 3 was performed for the optimized cut angle of 160and cut depth of 0.12-mm, but for ρ = 1, since generating a working mesh for ρ = 1/2 was problematic under the prescribed boundary conditions.
Reporting the findings for this test case, a small difference was noticed in comparison with the second loading condition. A force of 6.26 N was obtained as opposed to 6.93 N (10% difference). The same trend is expected for ρ = 1/2 but most likely, the percent variation differs. However, this decrease in barb strength would be accounted for in safety factors when determining the number of barbs required to be anchored within the tendon [Table 18].
Results for optimized cut angle and cut depth for ρ = 1 for load cases 2 and 3
| Results for ρ = 1, CA = 160, CD = 0.12 mm | |
|---|---|
| BarbElem | |
| Von-mises (MPa) | Force (N) |
| Loading case 3 | |
| 42.8 | 6.26 |
| Loading case 2 | |
| 47.39 | 6.93 |
As aforementioned, an estimation of the number of barbs required to hold a tendon force equivalent to 40 N can be simply found by dividing this force by the one withstood by a single barb.
For ρ = 1/2, CA = 160, CD = 0.12-mm, the force at the barb surface was recorded to be 7.71 N. This value represents the force at which crack propagation initiates. Certainly, the barb should be loaded at forces lower than the threshold. And since for the third loading case, a value lower than 7.71 is anticipated, the force at the barb surface is assumed to be 5 N, 35% less. Taking into consideration a factor of safety of 3, the required number of barbs to be anchored in the tendon to withstand 40 N becomes:
Hence, 24 barbs are required. Note that this number is a mere estimate.
Discussion
The mechanisms that led to the obtained results are discussed and the outcomes of the finite element analysis are not accepted at face value.
For a constant cut angle and cut depth, it was noticed that decreasing the aspect ratio below ρ = 1 resulted in stronger sutures, or more accurately, barbs. For this case, since the remaining areas of the ellipses are the same, the only variables are the cut length [CL = CD/sin (180 - CA)] and the crack length. As the aspect ratio increases from 1/3 to 3, the cut length, which is also equal to the minor axis “b” of the elliptical barb, increases as well, while the crack length, twice the major axis “2a” of the barb, decreases proportionally [Table 14].
With this in mind, we suspect that the main reason behind the observed results is the stress intensity factor. For Modes I and II, KI = σ(πa)1/2 FI(a/W) and KII = τ(πa)1/2FII(a/W) respectively, where are the characteristic stresses in the part, a is the crack length, W is the width of the part, and FI, FII are functions of the ratio of the crack length to the width of the specimen and the type of the load being applied. Contours of stress intensity factors for a stationary crack were plotted on ABAQUS. The average values are reported in Table 19.
Stresses intensity factors for Modes I, II and III
| Stress intensity factors | |||
|---|---|---|---|
| Aspect ratio | KI [MPa (m)1/2] | KII [MPa (m)1/2] | KIII [MPa (m)1/2] |
| 1/3 | 105 | -122 | -4.11 |
| 1/2 | 106 | -119 | -1.6 |
| 1 | 57.7 | -79.5 | -1.14 |
| 2 | 79.4 | -120 | 2.34 |
| 3 | 66.3 | -124 | -0.484 |
It is evident that mixed-mode crack growth takes place with a slight Mode II dominance. The observed trend for varying the aspect ratio is a result of the combination of the three Modes, governed by the mixed-mode power law. The resultant stress intensity factor, or more specifically, energy release rate is suspected to be highest for ρ = 3 followed by 2, 1, 1/2 and finally 1/3. This explains the decrease in suture/barb strength as the aspect ratio is varied from 1/3 to 3.
For a constant aspect ratio, two opposing behaviors were noted. A stronger suture is obtained for a decreasing cut depth but an increasing cut angle. However, with respect to barb strength, an increase in both cut angle and cut depth enhanced the performance of the barb.
Considering the first case, for a constant cut angle, decreasing the cut depth means that the crack size has been reduced (smaller barb), leading to an increased strength of the body of the suture. As for a constant cut depth, the increase in cut angle results in a longer cut length, which can be observed as the moment arm that translates the forces at the barb surface into compressive stresses at the crack tip [Figure 21]. The higher the compressive stresses, the more opposition there is to crack growth, and the stronger the suture is.
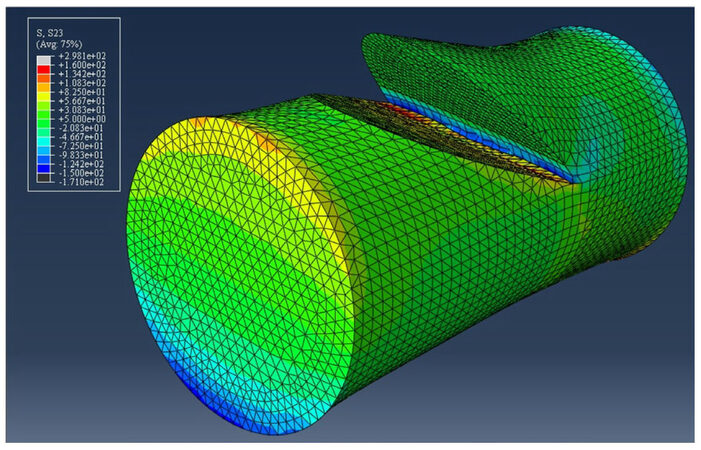
Figure 21. Plot of shear stresses (S23) for ρ = 1, CA = 154°, CD = 0.19 mm for load case 1. Notice the initiation of crack propagation mid crack length
For the second case, the logic is more straightforward. Increasing both the cut angle and cut depth leads to larger barb areas that can tolerate higher forces.
In conclusion, the extended finite element method has been successfully implemented on ABAQUS to predict crack growth in viscoelastic material. It was successfully used to assess the mechanical performance of barbed sutures for the repair of flexor tendon injuries and ultimately suggest a new optimized suture geometry for a novel single-stranded repair technique. Without doubt, the outcome of this work presents a solid foundation towards the use of a new barbed suture design for a novel single-stranded repair technique, but for a more comprehensive assessment, more investigations are still needed. For future studies, the use of material with superior mechanical properties, as polyglyconate instead of polypropylene, should be investigated in order to increase the suture strength. The different investigations for mechanical properties evaluation should be performed at 37 instead of doing them at room temperature, as the material is going to be implemented into the human body. The Numbers of barbs and their distribution on the suture should be assessed more accurately taking into consideration that not all barbs will carry the same load. Finally, the loading investigations should be performed on a suture with multiple barbs simultaneously instead of doing them on only one barb in order to assess the interaction between barbs.
Declarations
Authors’ contributionsMedical and surgical part of this work: Bakhach J, Oneissi A, Karameh R
Literature review, photos design and tables: Bakhach D
Biomechanical investigations and studies: Hiba K, Elie S
Availability of data and materialsMaterials and data come from within the organization; they follow the privacy policy and can be repeated again.
Financial support and sponsorshipNone.
Conflicts of interestAll authors declared that there are no conflicts of interest.
Ethical approval and consent to participateNot applicable.
Consent for publicationNot applicable.
Copyright© The Author(s) 2018.
REFERENCES
1. McClellan WT, Schessker MJ, Ruch DS, Levin LS, Goldner RD. A knotless flexor tendon repair technique using a bidirectional barbed suture: an ex vivo comparison of three methods. Plast Reconstr Surg 2011;128:e322-7.
3. Strickland JW. Development of flexor tendon surgery: twenty-five years of progress. J Hand Surg 2000;25:214-35.
4. Jordan MC, Hölscher-Doht S, Jakubietz MG, Jakubietz RG, Meffert RH, Schmidt K. Suture material for flexor tendon repair: 3-0 V-Loc versus 3-0 Stratafix in a biomechanical comparison ex vivo. J Orthop Surg Res 2014;9:72.
5. Gussous YM, Zhao C, Amadio P, An KN. The resurgence of barbed suture and connecting devices for use in flexor tendon tenorrhaphy. Hand 2011;6:268-75.
6. Joyce CW, Sugrue C, Chan JC, Delgado L, Zeugolis D, Carroll SM, Kelly JL. A barbed suture repair for flexor tendons: a novel technique with no exposed barbs. Plast Reconstr Surg Glob Open 2014;2:e237.
7. Naleway SE, Lear W, Kruzic JJ, Maughan CB. Mechanical properties of suture materials in general and cutaneous surgery. J Biomed Mater Res B Appl Biomater 2015;103:735-42.
8. Viinikainen A, Goransson H, Huovinen K, Kellomaki M, Rokkanen P. A comparative analysis of the biomechanical behavior of five flexor tendon core sutures. J Hand Surg Br 2004;29:536-43.
9. Parikh PM, Davison SP, Higgins JP. Barbed suture tenorrhaphy: an ex vivo biomechanical analysis. Plast Reconstr Surg 2009;124:1551-8.
10. Rawson S, Cartmell S, Wong J. Suture techniques for tendon repair; a comparative review. Muscles Ligaments Tendons J 2013;3:220-8.
11. Kanz BN, Morris RP, Lewis T, Panchbhavi VK. Biomechanical evaluation of a knotless barbed suture repair in a human Achilles tendon rupture model. Foot Ankle Special 2014;7:176-81.
12. Marrero-Amadeo IC, Chauhan A, Warden SJ, Merrell GA. Flexor tendon repair with a knotless barbed suture: a comparative biomechanical study. J Hand Surg 2011;36:1204-8.
13. Lin TE, Lakhiani C, Lee MR, Saint-Cyr M, Sammer DM. Biomechanical analysis of knotless flexor tendon repair using large-diameter unidirection barbed suture. Hand 2013;8:315-9.
14. Vizesi F, Jones C, Lotz N, Gianoutsos M, Walsh WR. Stress relaxation and creep: viscoelastic properties of common suture materials used for flexor tendon repair. J Hand Surg 2008;33:241-6.
15. Von Fraunhofer JA, Storey RS, Stone IK, Masterson BJ. Tensile strength of suture materials. J Biomed Mat Res 1985;19:595-600.
16. Von Fraunhofer J, Storey R, Masterson B. Tensile properties of suture materials. Biomaterials 1988;9:324-7.
17. Greenwald D, Shumway S, Albear P, Gottlieb L. Mechanical comparison of 10 suture materials before and after in vivo incubation. J Surg Res 1994;56:372-7.
18. Ingle N, King M. Optimizing the tissue anchoring performance of barbed sutures in skin and tendon tissues. J Biomech 2010;43:302-9.
19. Peltz TS, Haddad R, Scougall PJ, Gianoutsos MP, Bertollo N, Walsh WR. Performance of a knotless four-strand flexor tendon repair with a unidirectional barbed suture device: a dynamic ex vivo comparison. J Hand Surg Eur Vol 2014;39:30-9.
20. Ingle N, King M, Zikry M. Finite element analysis of barbed sutures in skin and tendon tissues. J Biomech 2010;43:879-86.
21. Zeplin PH, Zahn RK, Meffert RH, Schmidt K. Biomechanical evaluation of flexor tendon repair using barbed suture material: a comparative ex vivo study. J Hand Sur 2011;36:446-9.
22. Trail I, Powell E, Noble J. An evaluation of suture materials used in tendon surgery. J Hand Sur Br 1989;14:422-7.
23. Dennis C, Sethu S, Nayak S, Mohan L, Morsi YY, Manivasagam G. Suture materials - current and emerging trends. J Biomed Mat Res A 2016;104:1544-59.
24. Williams J. Visco-elastic and thermal effects on crack growth in PMMA. Inter J Fract Mech 1972;8:393-401.
25. Knauss WG. Delayed failure - the Griffith problem for linearly viscoelastic materials. Inter J Fract Mech 1970;6:7-20.
26. Knauss WG. On the steady propagation of a crack in a viscoelastic sheet: experiments and analysis. In: Deformation and Fracture of High Polymers. Springer; 1973. pp. 501–41.
27. Mac Cartney LN. Crack growth laws for a variety of variety of viscoelastic solid using energy and COD fracture criteria. Inter J Fract 1979;15:31-40.
28. Ward SR, Loren GJ, Lundberg S, Lieber RL. High stiffness of human digital flexor tendons is suited for precise finger positional control. J Neurophysiol 2006;96:2815-8.
29. Sapienza A, Yoon HK, Karia R, Lee SK. Flexor tendon excursion and load during passive and active simulated motion: a cadaver study. J Hand Sur Eur Vol 2013;38:964-71.
30. Schapery R. A theory of crack initiation and growth in viscoelastic media. Inter J Fract 1975;11:141-59.
31. Schapery R. A theory of crack initiation and growth in viscoelastic media II. Approximate methods of analysis. Inter J Fract 1975;11:369-88.
32. Schapery R. A theory of crack initiation and growth in viscoelastic media. III- Analysis of continuous growth. Inter J Fract 1975;11:549-62.
33. Schapery R. A method for predicting crack growth in nonhomogeneous viscoelastic media. Inter J Fract 1978;14:293-309.
34. McCartney L. Crack propagation, resulting from a monotonic increasing applied stress, in a linear viscoelastic material. Inter J Fract 1977;13:641-54.
35. McCartney L. Crack propagation in linear viscoelastic solids: some new results. Inter J Fract 1978;14:547-54.
37. Christensen R. Lifetime predictions for polymers and composites under constant load. J Rheol 1981;25:517-28.
38. Christensen R, Glaser R. The application of kinetic fracture mechanics to life prediction for polymeric materials. J Appl Mech 1985;52:1-5.
Cite This Article
Export citation file: BibTeX | RIS
OAE Style
Bakhach J, Oneissi A, Bakhach D, Karami R, Hiba K, Elie S. Optimization of the design of a barbed suture for flexor tendon repair using extended finite element analysis. Plast Aesthet Res 2018;5:21. http://dx.doi.org/10.20517/2347-9264.2018.14
AMA Style
Bakhach J, Oneissi A, Bakhach D, Karami R, Hiba K, Elie S. Optimization of the design of a barbed suture for flexor tendon repair using extended finite element analysis. Plastic and Aesthetic Research. 2018; 5: 21. http://dx.doi.org/10.20517/2347-9264.2018.14
Chicago/Turabian Style
Bakhach, Joseph, Ahmad Oneissi, Dimitri Bakhach, Reem Karami, Kobeissi Hiba, Shammas Elie. 2018. "Optimization of the design of a barbed suture for flexor tendon repair using extended finite element analysis" Plastic and Aesthetic Research. 5: 21. http://dx.doi.org/10.20517/2347-9264.2018.14
ACS Style
Bakhach, J.; Oneissi A.; Bakhach D.; Karami R.; Hiba K.; Elie S. Optimization of the design of a barbed suture for flexor tendon repair using extended finite element analysis. Plast. Aesthet. Res. 2018, 5, 21. http://dx.doi.org/10.20517/2347-9264.2018.14
About This Article
Copyright

Data & Comments
Data
0

 Cite This Article 1 clicks

 Like This Article 1
likes
Like This Article 1
likes


Comments
Comments must be written in English. Spam, offensive content, impersonation, and private information will not be permitted. If any comment is reported and identified as inappropriate content by OAE staff, the comment will be removed without notice. If you have any queries or need any help, please contact us at support@oaepublish.com.